This article is more than 7 years old
Africa Check publishes regular reports and factsheets relating to migration in southern Africa, from claims on asylum seekers and refugees to data on economic migrants.
In previous reports, experts have told us that accurate or precise information on migrant populations in South Africa is hard to obtain because of inadequate data collection systems and irregular migration patterns. Another reason is that both governments and non-governmental organisations have a vested interest in exaggerating immigrant numbers, either to justify stricter immigration controls or secure increased donor funding.
This perpetuates a situation where anecdote rather than data tends to make headlines – like claims broadcast by South African media stating that more than 1.5-million Zimbabweans live in South Africa, or that almost a third of Malawi’s population live and work in South Africa (if this was true, it would be a figure close to six million people!).
Anecdotal rhetoric may contribute to negative stereotypes around foreign-born migrants in South Africa and heighten fears that, for example, migrants are “stealing” South African jobs.
So, what do we know for sure – and where is “further research” required?
The 2011 census reported that more than 75% of foreign-born (international) migrants living in South Africa came from the African continent. African migrants from SADC countries contributed the vast majority of this, making up 68% of total international migrants. Immigrants from African countries outside of the SADC region made up just 7,3% of all international migrants.
International migrants in South Africa by origin
Source: Census 2011
Initial statistical reports from Statistics South Africa’s (Stats SA) 2016 Community Survey show that Zimbabwe, Mozambique, Lesotho, Malawi, Swaziland and Namibia were among the top 10 “sending countries” (countries of origin of migrants) in 2016, together with the United Kingdom, Democratic Republic of Congo, Nigeria and India.
Full statistical data for the 2016 survey has not yet been published, which means it is not possible at this time to accurately calculate total proportions of countries or regions of origin for this period. Such proportions – framed in terms of total international immigration into South Africa – may also cloud relevant demographic data about the sending country.
“While Zimbabwe and Mozambique are the largest [international migrants] by number, Lesotho is the highest by proportion; almost half of working age Basotho men work in South Africa,” said Professor Loren Landau, the South African research chair in mobility and the politics of difference at the University of the Witwatersrand’s African Centre for Migration and Society.
According to a StatsSA report on migration dynamics, the consistently high rate of migration from SADC countries is due to a colonial and apartheid-era regional “history of labour migration, especially from Mozambique, Lesotho, Malawi, Zimbabwe and Swaziland.”
The same report adds that South Africa is regarded as an “important destination for many people who seek better socio-economic opportunities” due its relatively stable democratic government, good infrastructure and economic stability. According to StatsSA issues like political unrest, economic instability and even “environmental degradation” in the African region have resulted in increased numbers of displaced persons, increasing the number of both documented and undocumented migrants in South Africa and other middle- and high-income countries globally.
The United Nations Department of Economic and Social Affairs International Migration Report for 2013 indicates that the annual level of net immigration (net migration is the difference between immigration and emigration) for South Africa stood at 96,000 per year for the period between 1990 and 2000, and then rose dramatically to 247,000 annually between 2000 and 2010.
According to data from Census 2011, of the international migrants enumerated nearly half (47%) were recent migrants, having moved to South Africa between one and five years before the census. About 14% had moved to South Africa in the previous six to ten years, with 1.6% arriving between 1994 and 2000; 21% said they had moved to South Africa pre-democracy, with 6.5% of respondents not specifying the year they moved to South Africa.
One of the reasons that it is hard to find total statistics on international migration is that undocumented migrants (those without the legal permission to be in the country, or who are in the country under a different permit than their intended or actual use) are likely less willing to participate in official surveys, and are possibly less likely to answer honestly, or respond to all the questions when they do participate. Dr Sally Peberdy, from the Southern African Migration Project (SAMP) network, currently based at the Gauteng City Region Observatory, told Africa Check that the number of just the undocumented migrants in South Africa could be anywhere between 1- and 2-million people.
Based on reports released by StatsSA, the profile of documented migrants entering South Africa – those who receive legal permits to work, study, live, receive medical treatment, do business, or even retire – shows several significant variations from the origin-profiles of the larger sample of all international migrants.
For example, the most recent Stats SA publication on documented immigrants in 2014, shows that the largest number – just over 66% – of 69,216 temporary residence permits (visas, including work and study permits) issued that year were issued to nationals from the following 10 countries:
Source: Statistics South Africa
Zimbabwe, Nigeria, India, China and Pakistan have comprised the top five sending countries for temporary residence visas for 2011, 2012, 2013 and 2014.
Unlike “all international migrants”, the sample of documented migrants who received temporary permits in 2014 showed that, while Africa still made up the single largest region of origin (52,5%), nationals from SADC countries (33,3%) and the Asian region (30,6%) made up a nearly equal proportion of successful permit applications. Similar proportions can be seen in the 2013 immigration documentation data.
In the same 2014 period 4,136 permanent residence permits were issued. The majority of residence permits were issued to citizens from Zimbabwe (36.2%), followed by India (9.6%), China (8.1%), DRC (6.7%), Nigeria (4.2%), UK (3.9%), Lesotho (2.9%), Pakistan (2.1%), Germany (1.8%) and Zambia (1.7%).
According to StatsSA, in 2014 there were over 65,500 refugees and 230,000 asylum-seekers in South Africa. The major countries of origin for refugees were listed as being Somalia, the DRC, Angola and Ethiopia.
The documented migrant data shows us who is granted permission, annually, to reside in South Africa – but does not necessarily indicate total or cumulative international migrant population sizes, because it does not show us numbers or proportions of undocumented migrants.
Censuses and community surveys are important because they potentially gather cumulative (lifetime) data on both documented and undocumented migrants (with some limitations), while Stats SA’s reports on documented immigration only offer annual information about the latter group.
Several international organisations, such as the United Nations and the International Organisation for Migration, produce reports with migration data (either on all migrants, or only on asylum-seekers and refugees) on South Africa. These reports or data sets (many based on each other’s reports) also come with associated reporting and interpretive problems.
As in the accompanying factsheet on international migration demographics, there are significant differences in estimates by country of origin between StatsSA’s
2016 Community Survey and those estimated by the United Nations Department of Economic and Social Affairs (DESA).
The International Organisation for Migration, using Desa’s 2015 estimates, published an infographic showing migrants’ countries of origin. According to the infographic, there were 318,536 people from the United Kingdom living in South Africa – but the 2016 Community Survey only found 56,412.
The DESA report indicates that, for South Africa, the international migrant population includes both (what it defines as) “B” or foreign-born and “R” or refugees.
A representative of the migration section of the population division at DESA told Africa Check via email that it, for its inputs, it used the South African census 2011 data together with United Nations refugee numbers from 2014, and added both of these together. As countries like the United Kingdom are unlikely to be a major sending country for refugees, that category is unlikely to account for the discrepancy indicated in the table above. The vast difference between data sets suggests closer investigation of both is required.
Africa Check is in communication with StatsSA and demography researchers and will publish updated information on this as it becomes available.
Migration involves immigration and emigration – neither of which can be assumed to be voluntary. In addition to the immigration figures documented by StatsSA, the department of home affairs also documents a large number of deportations annually.
According to the department’s 2014/15 annual report, in that year a total of 54,169 persons were deported; 82% of deportees were from three neighbouring countries including Mozambique (19,562), Zimbabwe (13,962) and Lesotho (11, 012).
The department of home affairs captures information on international travellers entering and leaving through official ports of entry in South Africa. StatsSA publishes these as monthly tourism and migration reports. It should be noted that this data captures visits to South Africa rather than visitors (one person can enter South Africa more than once in the period for which statistics are reported).
SADC travellers make up the large majority of visits to South Africa every year. In April 2016, 80% of the visits to South Africa by foreign travellers were by road, 19% by plane, and less than 1% by sea. (There have been no direct rail routes to South Africa for a number of years now). Travellers who do not possess a valid passport are plausibly more likely to enter the country via road, said Peberdy, as are very low-income migrants. It is therefore likely that the percentage of migrants who enter via road is higher than 80%.
Most Zimbabwean visits to South Africa in April 2016 were by road (92%); as were visits from other neighbouring countries (for Namibia this rate was lower, at two-thirds). Travellers from all non-neighbouring countries use air transport far more than road transport; with the exception of Zambia and Malawi, the majority of whom travel by road, moving through other countries en-route to South Africa. Perhaps unexpectedly, one third (35%) of Pakistani arrivals to South Africa were via road.
Once in South Africa, many foreign migrants head for Gauteng – the economic centre of South Africa, and the province with the largest population of foreign-born migrants. The population of foreign-born migrants in Gauteng is slightly higher than the population of foreign born migrants in all other provinces combined. The 2011 census calculated that 9.5% of the population in Gauteng was foreign born, while the 2016 survey puts this at a much lower 6%.
The number of foreign migrants per municipality within Gauteng varies quite substantially, with mining areas often showing higher proportions of international migrants. According to a 2013 report from the GCRO, in 2011 more than 17% of the population of Westonaria was foreign-born. In Merafong this figure stood at 12%. The foreign-born population in Johannesburg was calculated to be 13% of the total, and 10% in Midvaal. According to the GCRO all other municipalities in Gauteng had a foreign-born population of less than 10%.
After Gauteng, the Western Cape had the next highest percentage and number of foreign migrants at the time of the Census (4.6%), followed closely by the North West (4.4%), though slightly higher numbers of foreign migrants were captured in Mpumalanga than the North West. The Northern Cape had the lowest number.
StatsSA explains that international migrants preferring to settle in Limpopo, North West and Mpumalanga “may be as a result of similarity in cultural background, language as well as proximity to country of birth, e.g. Mozambique and Mpumalanga, Zimbabwe and Limpopo”, adding that a substantial number of immigrants in Limpopo and Mpumalanga work in low-skill positions, such as farm labourers.
It is worth noting that international migration – even to Gauteng – is still far lower than domestic migration from other provinces. At the time of the last census, 37% of people residing in Gauteng were South Africans born in other provinces.
Edited by Nechama Brodie
Read more:
Part one: How many international migrants are there in SA?
Part three: Domestic migration in South Africa
In previous reports, experts have told us that accurate or precise information on migrant populations in South Africa is hard to obtain because of inadequate data collection systems and irregular migration patterns. Another reason is that both governments and non-governmental organisations have a vested interest in exaggerating immigrant numbers, either to justify stricter immigration controls or secure increased donor funding.
This perpetuates a situation where anecdote rather than data tends to make headlines – like claims broadcast by South African media stating that more than 1.5-million Zimbabweans live in South Africa, or that almost a third of Malawi’s population live and work in South Africa (if this was true, it would be a figure close to six million people!).
Anecdotal rhetoric may contribute to negative stereotypes around foreign-born migrants in South Africa and heighten fears that, for example, migrants are “stealing” South African jobs.
So, what do we know for sure – and where is “further research” required?
Most international migrants in SA come from SADC
The 2011 census reported that more than 75% of foreign-born (international) migrants living in South Africa came from the African continent. African migrants from SADC countries contributed the vast majority of this, making up 68% of total international migrants. Immigrants from African countries outside of the SADC region made up just 7,3% of all international migrants.
International migrants in South Africa by origin
| Country | % |
| Africa | 75.3 |
| Asia | 4.7 |
| Europe | 8.2 |
| Latin America and The Caribbean | 0.3 |
| North America | 0.3 |
| Oceania | 0.2 |
| Unspecified | 11 |
Source: Census 2011
Initial statistical reports from Statistics South Africa’s (Stats SA) 2016 Community Survey show that Zimbabwe, Mozambique, Lesotho, Malawi, Swaziland and Namibia were among the top 10 “sending countries” (countries of origin of migrants) in 2016, together with the United Kingdom, Democratic Republic of Congo, Nigeria and India.
Full statistical data for the 2016 survey has not yet been published, which means it is not possible at this time to accurately calculate total proportions of countries or regions of origin for this period. Such proportions – framed in terms of total international immigration into South Africa – may also cloud relevant demographic data about the sending country.
“While Zimbabwe and Mozambique are the largest [international migrants] by number, Lesotho is the highest by proportion; almost half of working age Basotho men work in South Africa,” said Professor Loren Landau, the South African research chair in mobility and the politics of difference at the University of the Witwatersrand’s African Centre for Migration and Society.
A 'history of labour migration'
According to a StatsSA report on migration dynamics, the consistently high rate of migration from SADC countries is due to a colonial and apartheid-era regional “history of labour migration, especially from Mozambique, Lesotho, Malawi, Zimbabwe and Swaziland.”
The same report adds that South Africa is regarded as an “important destination for many people who seek better socio-economic opportunities” due its relatively stable democratic government, good infrastructure and economic stability. According to StatsSA issues like political unrest, economic instability and even “environmental degradation” in the African region have resulted in increased numbers of displaced persons, increasing the number of both documented and undocumented migrants in South Africa and other middle- and high-income countries globally.
The United Nations Department of Economic and Social Affairs International Migration Report for 2013 indicates that the annual level of net immigration (net migration is the difference between immigration and emigration) for South Africa stood at 96,000 per year for the period between 1990 and 2000, and then rose dramatically to 247,000 annually between 2000 and 2010.
According to data from Census 2011, of the international migrants enumerated nearly half (47%) were recent migrants, having moved to South Africa between one and five years before the census. About 14% had moved to South Africa in the previous six to ten years, with 1.6% arriving between 1994 and 2000; 21% said they had moved to South Africa pre-democracy, with 6.5% of respondents not specifying the year they moved to South Africa.
Documented vs undocumented migrants
One of the reasons that it is hard to find total statistics on international migration is that undocumented migrants (those without the legal permission to be in the country, or who are in the country under a different permit than their intended or actual use) are likely less willing to participate in official surveys, and are possibly less likely to answer honestly, or respond to all the questions when they do participate. Dr Sally Peberdy, from the Southern African Migration Project (SAMP) network, currently based at the Gauteng City Region Observatory, told Africa Check that the number of just the undocumented migrants in South Africa could be anywhere between 1- and 2-million people.
Based on reports released by StatsSA, the profile of documented migrants entering South Africa – those who receive legal permits to work, study, live, receive medical treatment, do business, or even retire – shows several significant variations from the origin-profiles of the larger sample of all international migrants.
For example, the most recent Stats SA publication on documented immigrants in 2014, shows that the largest number – just over 66% – of 69,216 temporary residence permits (visas, including work and study permits) issued that year were issued to nationals from the following 10 countries:
| Country | Number | % |
| Zimbabwe | 12,521 | 18.1 |
| India | 6,195 | 9.0 |
| Nigeria | 6,087 | 8.8 |
| China | 5,739 | 8.3 |
| Pakistan | 4,551 | 6.6 |
| Bangladesh | 3,103 | 4.5 |
| UK | 2,391 | 3.5 |
| Lesotho | 2,375 | 3.4 |
| DRC | 1,614 | 2.3 |
| Angola | 1,571 | 2.3 |
Source: Statistics South Africa
Zimbabwe, Nigeria, India, China and Pakistan have comprised the top five sending countries for temporary residence visas for 2011, 2012, 2013 and 2014.
Unlike “all international migrants”, the sample of documented migrants who received temporary permits in 2014 showed that, while Africa still made up the single largest region of origin (52,5%), nationals from SADC countries (33,3%) and the Asian region (30,6%) made up a nearly equal proportion of successful permit applications. Similar proportions can be seen in the 2013 immigration documentation data.
In the same 2014 period 4,136 permanent residence permits were issued. The majority of residence permits were issued to citizens from Zimbabwe (36.2%), followed by India (9.6%), China (8.1%), DRC (6.7%), Nigeria (4.2%), UK (3.9%), Lesotho (2.9%), Pakistan (2.1%), Germany (1.8%) and Zambia (1.7%).
According to StatsSA, in 2014 there were over 65,500 refugees and 230,000 asylum-seekers in South Africa. The major countries of origin for refugees were listed as being Somalia, the DRC, Angola and Ethiopia.
The documented migrant data shows us who is granted permission, annually, to reside in South Africa – but does not necessarily indicate total or cumulative international migrant population sizes, because it does not show us numbers or proportions of undocumented migrants.
Censuses and community surveys are important because they potentially gather cumulative (lifetime) data on both documented and undocumented migrants (with some limitations), while Stats SA’s reports on documented immigration only offer annual information about the latter group.
Survey numbers often do not match up
Several international organisations, such as the United Nations and the International Organisation for Migration, produce reports with migration data (either on all migrants, or only on asylum-seekers and refugees) on South Africa. These reports or data sets (many based on each other’s reports) also come with associated reporting and interpretive problems.
As in the accompanying factsheet on international migration demographics, there are significant differences in estimates by country of origin between StatsSA’s
2016 Community Survey and those estimated by the United Nations Department of Economic and Social Affairs (DESA).
The International Organisation for Migration, using Desa’s 2015 estimates, published an infographic showing migrants’ countries of origin. According to the infographic, there were 318,536 people from the United Kingdom living in South Africa – but the 2016 Community Survey only found 56,412.
| Country | 2016 Community Survey | 2015 DESA Estimate |
| Zimbabwe | 574,047 | 475,406 |
| Mozambique | 293,405 | 449,710 |
| Lesotho | 160,749 | 350,611 |
| Malawi | 78,796 | 76,605 |
| United Kingdom | 56,412 | 318,536 |
| Swaziland | 38,038 | 91,232 |
| Democratic Republic of Congo | 31,504 | 70,077 |
| Namibia | 30,701 | 133,282 |
| Nigeria | 30,314 | 17,753 |
The DESA report indicates that, for South Africa, the international migrant population includes both (what it defines as) “B” or foreign-born and “R” or refugees.
A representative of the migration section of the population division at DESA told Africa Check via email that it, for its inputs, it used the South African census 2011 data together with United Nations refugee numbers from 2014, and added both of these together. As countries like the United Kingdom are unlikely to be a major sending country for refugees, that category is unlikely to account for the discrepancy indicated in the table above. The vast difference between data sets suggests closer investigation of both is required.
Africa Check is in communication with StatsSA and demography researchers and will publish updated information on this as it becomes available.
Accounting for deportation
Migration involves immigration and emigration – neither of which can be assumed to be voluntary. In addition to the immigration figures documented by StatsSA, the department of home affairs also documents a large number of deportations annually.
According to the department’s 2014/15 annual report, in that year a total of 54,169 persons were deported; 82% of deportees were from three neighbouring countries including Mozambique (19,562), Zimbabwe (13,962) and Lesotho (11, 012).
80% of international visitors & migrants enter by road
The department of home affairs captures information on international travellers entering and leaving through official ports of entry in South Africa. StatsSA publishes these as monthly tourism and migration reports. It should be noted that this data captures visits to South Africa rather than visitors (one person can enter South Africa more than once in the period for which statistics are reported).
SADC travellers make up the large majority of visits to South Africa every year. In April 2016, 80% of the visits to South Africa by foreign travellers were by road, 19% by plane, and less than 1% by sea. (There have been no direct rail routes to South Africa for a number of years now). Travellers who do not possess a valid passport are plausibly more likely to enter the country via road, said Peberdy, as are very low-income migrants. It is therefore likely that the percentage of migrants who enter via road is higher than 80%.
Most Zimbabwean visits to South Africa in April 2016 were by road (92%); as were visits from other neighbouring countries (for Namibia this rate was lower, at two-thirds). Travellers from all non-neighbouring countries use air transport far more than road transport; with the exception of Zambia and Malawi, the majority of whom travel by road, moving through other countries en-route to South Africa. Perhaps unexpectedly, one third (35%) of Pakistani arrivals to South Africa were via road.
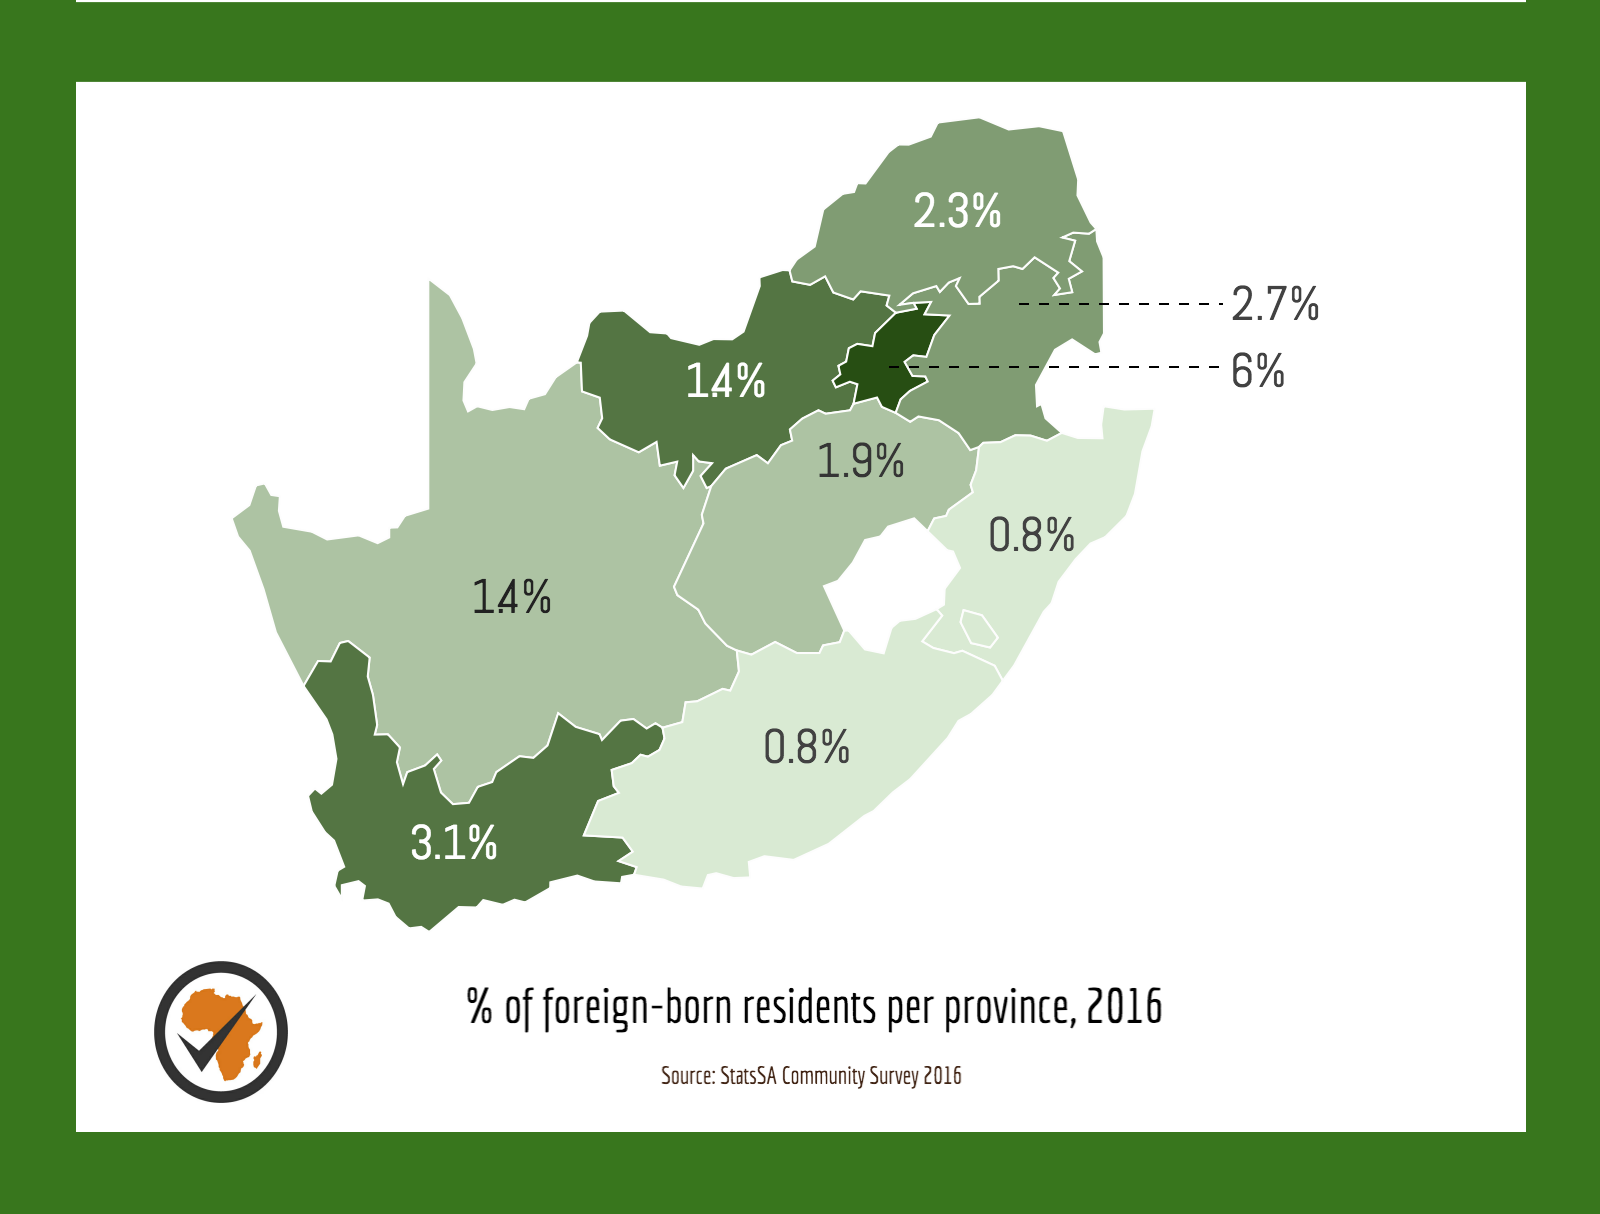
Most foreign-born migrants live in Gauteng
Once in South Africa, many foreign migrants head for Gauteng – the economic centre of South Africa, and the province with the largest population of foreign-born migrants. The population of foreign-born migrants in Gauteng is slightly higher than the population of foreign born migrants in all other provinces combined. The 2011 census calculated that 9.5% of the population in Gauteng was foreign born, while the 2016 survey puts this at a much lower 6%.
The number of foreign migrants per municipality within Gauteng varies quite substantially, with mining areas often showing higher proportions of international migrants. According to a 2013 report from the GCRO, in 2011 more than 17% of the population of Westonaria was foreign-born. In Merafong this figure stood at 12%. The foreign-born population in Johannesburg was calculated to be 13% of the total, and 10% in Midvaal. According to the GCRO all other municipalities in Gauteng had a foreign-born population of less than 10%.
After Gauteng, the Western Cape had the next highest percentage and number of foreign migrants at the time of the Census (4.6%), followed closely by the North West (4.4%), though slightly higher numbers of foreign migrants were captured in Mpumalanga than the North West. The Northern Cape had the lowest number.
StatsSA explains that international migrants preferring to settle in Limpopo, North West and Mpumalanga “may be as a result of similarity in cultural background, language as well as proximity to country of birth, e.g. Mozambique and Mpumalanga, Zimbabwe and Limpopo”, adding that a substantial number of immigrants in Limpopo and Mpumalanga work in low-skill positions, such as farm labourers.
It is worth noting that international migration – even to Gauteng – is still far lower than domestic migration from other provinces. At the time of the last census, 37% of people residing in Gauteng were South Africans born in other provinces.
Edited by Nechama Brodie
Read more:
Part one: How many international migrants are there in SA?
Part three: Domestic migration in South Africa
Add new comment