Do 774 South Africans become jobless every day, as the DA says?
Published on 21 January 2016
This article is more than 8 years old
As part of their municipal elections campaign, the Democratic Alliance (DA) party put up a billboard in Johannesburg city centre which - they say - shows the number of jobless people in South Africa since President Jacob Zuma came to power.
The DA’s press release stated that there were 1,842,852 people unemployed in the country on 6 January this year. Starting with this figure, the billboard contains a live ticker that shows a “total of 774 people that become jobless in every 24 hour cycle under the leadership of Zuma’s ANC government”.
How did the DA calculate this and are they correct?
Africa Check asked the DA for the source of their statistics. Spokesman to DA leader Mmusi Maimane, Mabine Seabe, explained that they used the quarterly labour force surveys carried out by Statistics South Africa in quarter two of 2009 (when Zuma took office) and the third quarter of 2015, which is the latest survey available at this stage.
Seabe said they added the number of unemployed people and discouraged work seekers to find the number of jobless people according to the broad definition of unemployment. They then calculated the difference between the two quarters:
Quarter 2 (2009)
Quarter 3 (2015)
Difference
Unemployed people
4,341,000
5,418,000
1,077,000
Discouraged job seekers
1,536,000
2,226,000
690,000
5,877,000
7,644,000
1,767,000
To calculate the rate by which their billboard counter ticked over, the DA used quite an elaborate formula. Take a breath:
First, the party counted the number of days between 1 July 2009 (the first day of the first full quarter Zuma was in power) to the last day of the last quarter for which a quarterly labour force survey is available. This gave 2,283 days. The DA then divided the 1,767,000 jobless people from their first calculation by 2,283 days to come up with the rate of 774 jobless people per day.
To calculate the starting point for their billboard, the DA counted the number of days between the start of the last quarter of 2015 (1 October) and the date of the unveiling of the billboard (6 January), a period of 98 days. Multiplying 98 by 774 equalled an additional 75,852 jobless people on their books. This figure was added to the nett figure of 1,767,000 unemployed people, leading to the DA’s starting number of 1,842,852.
However, this explanation does not feature in their press release.
‘Significant rise in unemployment’
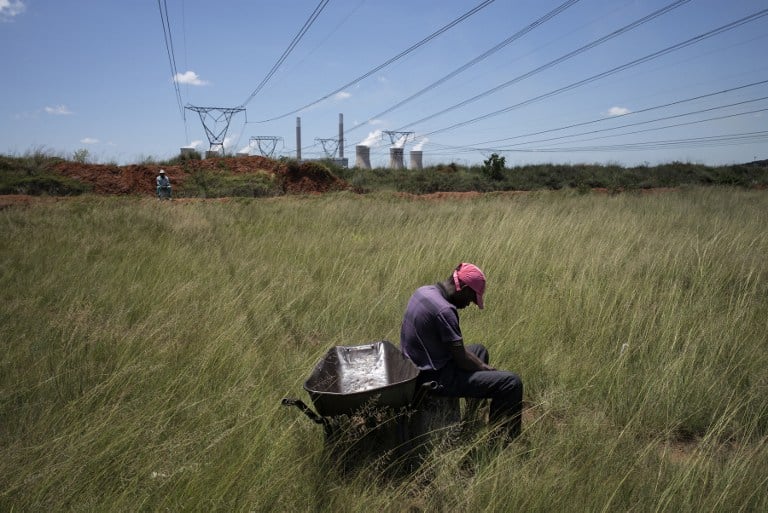
A jobless migrant worker waits in February 2015 near the Duvha Power Station outside Emalahleni for a weekly load of free coal from a mine nearby. Photo: AFP/MARCO LONGARI" />
Professor of economics at Rhodes University, Gavin Keeton, told Africa Check that the DA is correct that there has been a significant rise in unemployment in South Africa in the period under review.
South Africa’s unemployment rate was 23.2% in the second quarter of 2009 and had risen to 25.5% in the third quarter of 2015, according to the quarterly labour force survey trends for 2008 to 2015. Using the expanded definition of unemployment the rate rose from 31.7% in the second quarter of 2009 to 34.4% in the third quarter of 2015.
However, the DA had left out an increase of 1.47 million jobs over the same time in their calculations, Keeton pointed out. But “unemployment rose because the number of people looking for jobs rose faster than the increase in jobs,” he said.
DA undercounted the unemployed
Africa Check spoke to a manager in Stats SA’s labour unit, Monet Durieux. She said it was incorrect to add the number of unemployed people and discouraged work seekers to find the number of jobless people according to the broad definition of unemployment, as the DA did. (Note: Africa Check failed to spot this error by the DA when we previously fact-checked unemployment figures they cited. We have apologised and corrected our oversight.)
The DA should have used the number of unemployed people according to the broad definition released in a separate data set by Stats SA.
Instead of 5.88 million unemployed people in the second quarter of 2009, the correct figure the DA should have used is 6.68 million people. And in the third quarter of 2015 there were 8.3 million unemployed people according to the expanded definition, not 7.64 million.
This means a rise of 1.63 million unemployed people from the first full quarter Zuma was in power until 2015’s third quarter, not 1.77 million.
Stats SA have changed their survey sample
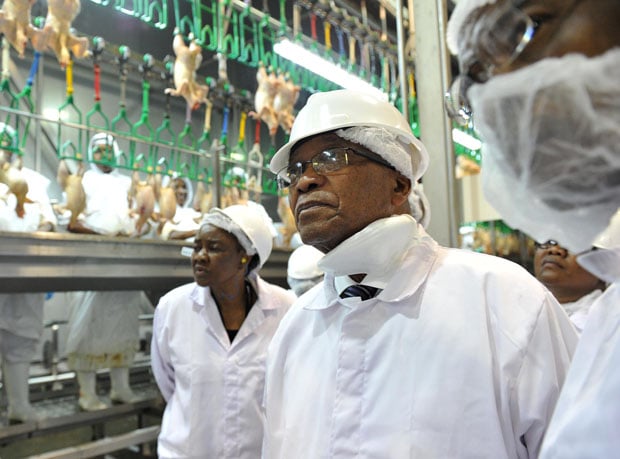
President Jacob Zuma during his visit in February 2014 to the Grainfield Chicken Farm Abattoir in Reitz in the Free State Province . The abattoir was funded by government through the unemployment insurance fund, among others. Photo: GCIS" />
So can we now go ahead and calculate the correct number of jobless people under Zuma’s watch?
Again it’s not that easy. Professor in the University of Cape Town’s school of economics, Martin Wittenberg, told Africa Check that there seems to be another thing the DA did not consider in their calculation.
He explained that there was a change in Stats SA’s survey sample and it can be seen in the large jump in unemployment numbers between the fourth quarter of 2014 and the first quarter of 2015. In the quarterly labour force survey for the fourth quarter of 2014 there were 4,909,000 unemployed people in South Africa according to the narrow definition of unemployment. In the first quarter of 2015 it jumped to 5,535,000.
Stats SA’s Durieux confirmed the change in their sample, saying that they previously used a sample based on 2001 census data. For 2015 they updated their sample and based it on data from the 2011 census, which was more extensive.
Durieux cautioned against making comparisons between statistics from the old sample and the new one without acknowledging the changes. “In our publication we are comparing data based on the old and new sample, but with a note regarding the fact that the estimates are derived from two different samples,” she said.
SA labour market follows clear pattern
One last thing to consider is that unemployment doesn’t follow a smooth trajectory. Stats SA’s Durieux explained to Africa Check that the South African labour market has a clear pattern of which “the daily number [of job losses and gains] can vary significantly”.
Because there is normally a rise in employment leading up to the festive season in December, Durieux found the DA’s calculation of the rise in unemployment during that time to be inaccurate. “Such a calculation provides no analytical basis to understand the dynamics in the labour market,” she said. By this Durieux meant that someone can move from being unemployed to being employed to not being economically active in a short period of time.
Duriex also highlighted that the first quarter of the year often sees a rise in unemployed people when large numbers of school leavers and casual workers employed during the festive season become jobless.
Conclusion: DA’s flawed unemployment billboard misleading
The large number of jobless people in South Africa needs the attention of all the parties contesting the upcoming municipal elections. However, the DA’s billboard ticking over the number of jobless people they say are added to the South African economy daily contains a number of flaws that undermines our understanding of this pressing problem.
First, the party did not take into consideration the number of jobs that have been created in the period they refer to. Secondly, the expanded definition of unemployed they used was incorrect, resulting in the use of wrong figures in their calculations.
Thirdly, the DA compared surveys that were based on two different survey samples, which Statistics SA advises should be done with caution. And finally, the South African labour market does not shed, or add, the same number of jobs daily.
Considering this, the DA may consider displaying an asterix next to their unemployment ticker and some fine print at the bottom of their billboard.


Add new comment