This article is more than 5 years old
| CORRECTION: The fact-check of the "average salary" claim was updated to use the total salary bill before certain costs were deducted. This did not change the verdict. |
Worker protests over pay at South Africa’s power utility have led to lights being turned off across the country.
The utility, Eskom, announced recently that it could not afford to give its workers an annual increase. Bonuses were also off the table. (Note: Eskom has entered into negotiations with workers and talks are ongoing.)
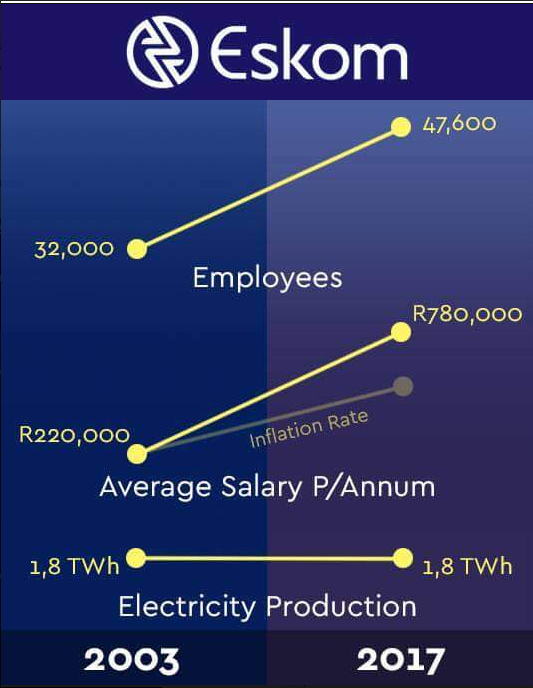
A viral infographic claims staff numbers have increased by almost 50% since 2003 and the “average salary” per year for an Eskom employee is R780,000. Meanwhile, electricity production has remained flat.
The infographic has been shared widely, but it is not clear who produced it.
Do these numbers check out? Africa Check dug into the power utility’s reports and financial statements to find out.
Eskom’s 2003 annual report states that as of 31 December 2003 it had 31,972 employees. The power utility’s latest annual report listed 47,658 employees as of 31 March 2017.
Eskom plans to cut staff numbers, however. Its 2016/17 annual report states that it is “targeting a reduction in the Eskom company workforce to 36,746” by the 2021/22 financial year.
How many employees should Eskom have?
A 2016 World Bank policy research working paper looked at the financial viability of electricity sectors in 39 sub-Saharan African countries.
It found that in 2014, South Africa’s power utility had the largest workforce out of the 39 countries - at 41,787. It also had the largest number of customers: just over 5.4 million.
The World Bank’s analysis of staffing levels estimated that Eskom only needed a workforce of 14,244 people. One assumption in the calculation was that in developing countries, there should be one employee for every 413 electricity customers.
Eskom was therefore 66% overstaffed. The only countries with higher than optimum staff levels were Zimbabwe (67%) and Zambia (71%).
The World Bank did point out that these exercises have limitations.
“This benchmarking analysis is necessarily simplified to be able to cover dozens of countries for cross-country comparison,” it explained. “Results for any individual country should not be used as a substitute for an indepth country-level analysis.”
What does Eskom do?
Benchmarking needs to be conducted and interpreted with care, cautioned Prof Anton Eberhard from the University of Cape Town’s Graduate School of Business. He has done research on the restructuring and regulation of the electricity sector and was part of a 2015 government advisory panel appointed to oversee Eskom’s turnaround.
“A lot of the utilities that the World Bank benchmarked Eskom against do everything. They generate electricity, they transmit it and they sell electricity to the end users,” he explained.
Eskom, however, does not distribute all its electricity. Half of it is sold to municipalities who manage the distribution.
“What that would suggest is that Eskom is over-employing. The fact that it doesn't even have a full distribution business means that it is definitely over-staffed.”
Power produced and employee numbers
The National Energy Regulator of South Africa (Nersa) conducted its own benchmarking analysis in 2017.
This showed that Eskom was able to produce 239,109 gigawatt hours (GWh) with 32,954 employees in 2007/08, or 7.26 GWh per employee. The power utility has said that it plans to produce 216,771 GWh with 39,186 employees in 2018/19, which works out to 5.3 GWh per employee.
“This means that Eskom is producing less GWh with more employees and higher employee costs,” Nersa said.
Based on these figures, Nersa suggested that Eskom was employing 6,232 more people than it needed to.
In response, Eskom said it was arbitrary to benchmark its output by GWh produced per employee and to choose 2007/08 as a base year. The power utility argued that, in that year, demand outstripped supply to such an extent that load shedding had to be introduced.
“Power stations were required to operate at output levels well above their design parameters or industry norms, thus artificially reducing the ratio of staff to electricity output,” Eskom explained.
Though staff benchmarking figures may differ, Eberhard said the estimates provided insight into the efficiency of a utility.
“We might quibble on the numbers but one thing is for sure: Eskom is overstaffed.”
Both the infographic and other sources have recently made claims about the “average salary” at Eskom.
The National Union of Mineworkers – which represents mine, construction and energy workers – rubbished these numbers, saying that their “members do not earn that kind of money”.
Calculating the real ‘average salary’
In 2003, Eskom’s staff costs totalled R7.7 billion. This number divided by 31,972 employees equals R241,993 per employee, more than the R220,000 stated in the infographic.
By 2017, Eskom’s staff costs had increased to R36.8 billion. Divided equally between 47,658 employees, this comes to R772,861 per employee, slightly less than the R780,000 stated in the infographic.
The infographic suggests the “average salary” at Eskom increased by R560,000 between 2003 and 2017. This is an exaggeration, as the the actual increase was R530,868.
Looking at the pay scale
Of course, staff costs are not split equally between all employees. But energy analyst Chris Yelland said the average was worth considering.
Eskom’s financial statements do not, however, provide a breakdown of pay levels.
Financial news website Moneyweb has published confidential Eskom documents revealing the salaries of the power utility’s bargaining unit employees. These are the 84% of employees whose salaries are negotiated between unions and Eskom management.
The documents show that employees on the unit’s lowest salary scale earn R135,390 per year and those on the highest R595,410 per year.
The infographic claimed that Eskom’s electricity production remained at 1.8 terawatt hours (TWh) from 2003 to 2017. This is equal to 1,800 GWh.
Eskom’s 2003 annual report states that the power utility produced 210,218 GWh that year. This is equal to 210 TWh. By 2017, Eskom’s production stood only slightly higher at 220,166 GWh - or 220 TWh.
The infographic’s output numbers are therefore incorrect. It suggests that Eskom produces 122 times less than it actually does. It also doesn’t show that there has been a small increase in production between 2003 and 2017.
Recent production is down
But electricity production in more recent years has decreased - rather than staying flat. Production peaked as high as 239,109 GWh in 2007/08.
While production is down from 10 years ago, Yelland told Africa Check that Eskom is meeting demand levels.
“The reduction in demand each year is related to the high price of electricity, which has been driving customers to use electricity more sparingly,” he said. “It has also put some energy-intensive companies out of business.”
Eskom has become less efficient at generating electricity, however. “Staff costs have been going up like a rocket while production volumes are going down,” Yelland said.
Edited by Anim van Wyk
Further reading:
https://africacheck.org/reports/does-south-african-face-an-electricity-grid-collapse-it-is-possible-but-unlikely/
https://africacheck.org/reports/is-nuclear-energy-really-the-cheapest-source-of-electricity/

Add new comment