This article is more than 5 years old
- Environmental group Greenpeace said its analysis of new satellite data had shown that South Africa’s Mpumalanga province was the world’s largest air pollution hotspot.
- Experts agree Mpumalanga’s high levels of air pollution are well known, and the new satellite images provide better detail.
- But the approach used by Greenpeace to make its conclusion has notable weaknesses. To improve national air quality accurate evidence is important to ensure scarce resources are used well.
But Greenpeace then said Mpumalanga only led the world for nitrogen dioxide emissions, as shown by the group’s “groundbreaking analysis” of new satellite data. Nitrogen dioxide is produced by combustion, such as in car engines or when coal and gas are burned for energy.
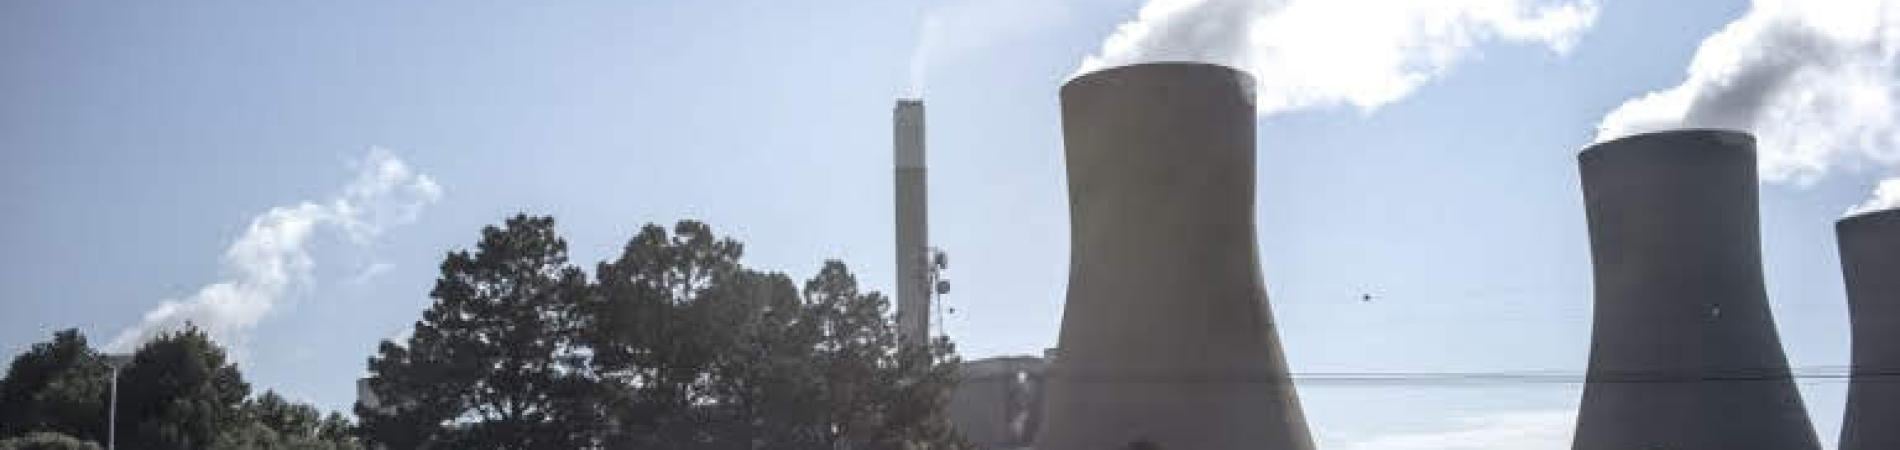
The watchdog blamed this on heavy coal use by power utility Eskom, which has 12 coal-fired stations in the province, and weak air pollution standards.
Greenpeace’s widely reported press release prompted parliament’s committee on the environment to hold a hearing in November 2018.
But does the province out-emit everyone else for nitrogen dioxide, including cities in India and China?
How the data was collected
Melita Steele, Greenpeace Africa’s senior climate and energy campaign manager, shared with Africa Check the approach the group used to reach its conclusion. She said the information was from a satellite operated by the Dutch government and the European Space Agency and launched in 2017. The data covered 1 June to 31 August 2018.
The satellite is at a height of 824 kilometres, the team that operates it told Africa Check. Gases in the atmosphere each absorb a specific wavelength of light, so an onboard instrument uses “absorption lines” to determine which gases are present and in what quantity.
Areas with raised concentrations of nitrogen dioxide were identified and the average amount of the gas present over the three-month period worked out. An international emissions database was then used to pinpoint the specific locations and probable sources of emissions.
Said Greenpeace: “The unprecedented detailed imagery from the satellite gives us a powerful ‘eye in the sky’ from which polluters cannot hide.”
Of the 50 largest “hotspots” identified, China had 10. There were eight in Arab states, four in the European Union and three each in India, the US and the Democratic Republic of Congo.
Mpumalanga pollution ‘known for years’
That Mpumalanga is a large source of air pollution has been well documented for years, scientists told Africa Check.
It’s caused by the location of several large power stations on its coalfields, said Prof Harold Annegarn of North-West University’s School of Geo and Spatial Sciences.
The arrangement of these stations was “unusual anywhere in the world”, Annegarn said. They were laid out in this way partly to reduce transport costs and make them closer to places that use large amounts of power.
“The consequence is a high concentration of emissions from them, including nitrogen dioxide. Nobody is disputing that.”
In 2007 the high emissions prompted the government to declare parts of Mpumalanga a national priority area, environmental department spokesperson Albi Modise told Africa Check. This allowed specific actions to be taken to improve air quality, such as better monitoring and regulation.
How high up is the pollution?
What is new, is the level of detail in satellite images used by Greenpeace, Prof Rebecca Garland told the parliamentary committee. She researches air quality and environmental health at the Council for Scientific and Industrial Research.
She said the method Greenpeace used to analyse the new satellite’s data was not yet without problems, but would be improved with time - helping strengthen estimates of emissions.
Annegarn said the satellite couldn’t tell at what height the nitrogen dioxide is situated. It only showed that there is a certain amount of the gas in the entire column of the atmosphere.
A significant fault with Greenpeace’s analysis was that “they jump from the concentration in the aerial density and emissions to say that the high number is equivalent to a high concentration at the ground level”, he told Africa Check.
The tall stacks on the power stations meant nitrogen dioxide was generally emitted at levels higher than where people breathe. Where the gas goes also depends on the wind and other weather, he said.
To find out how much pollution is in the air we breathe, other methods such as ground-based and aircraft measurements should be used with satellite measurements, Prof Pieter van Zyl of the School of Physical and Chemical Sciences at North-West University told Africa Check.
What are the outdoor concentrations in the air?
The environmental department told Africa Check it was monitoring outdoor air in real time, with the results published online.
“Ground level monitoring of nitrogen dioxide shows that our levels are below the national ambient (outdoor) air standards,” spokesman Albi Modise said. “Remember, this is the air we breathe and not the tropospheric [ up to about 10 km] nitrogen dioxide.”
The standards say that the amount of nitrogen dioxide in the air should not be more than 21 parts per billion, or 21 microgrammes per litre, averaged over a year.
An Africa Check review of 2018 data from the monitoring portal showed this limit had not been exceeded in the year to August.
The South African Weather Service operates five monitoring stations in the highveld priority area. They are International Organization for Standardization accredited, “thus all instruments are continuously scrutinised on their data accuracy and availability”, Kamaseelan Chetty, the senior manager responsible for air quality at the agency, told Africa Check.
Emissions most visible in winter and on high ground
“Is there a hotspot? Yes, but we cannot make comparisons and declare this is the world’s largest,” Garland said.
There were a number of reasons for this, she told lawmakers. These included the seasons. Greenpeace’s data spanned South Africa’s winter months. In winter the emissions would be most visible to satellites due to low dispersion. In eastern China, the eastern US and much of Europe, this peak occurs in January.
“This is comparing our peak almost to one of their lower periods. So it’s not quite fair. We would need more long-term measurements to say that,” Garland said. This would be at least a year’s worth of data, she told Africa Check.
Mpumalanga’s highveld was at a higher altitude, also making emissions more visible to the satellite, she said.
Annegarn added that the 25-kilometre radius Greenpeace used to define a “hotspot” was an arbitrary measure and had no “scientific relevance”.
International databases mainly capture what is well-known
There is also an issue of comparability of emissions captured in international databases, Garland said. “So many times the large point emission sources are well-known and estimated in these emission inventories, but the more local sources are not.”
For example, vehicle emissions and burning at people’s homes were also major contributors to nitrogen dioxide in Johannesburg, but these were not easily captured in such international databases.
Said Van Zyl: “As to whether Mpumalanga “is the world's biggest pollution hotpot is difficult to quantify based only on satellite retrievals for nitrogen dioxide. Levels of other very important pollutant species such as sulphur dioxide, carbon monoxide, ozone and particulate matter must also be considered.”
Greenpeace told the committee it would focus on other pollutants later.
Due to limited resources and the long-term nature of the problem, correctly identifying emission sources and their impact is important, Garland said.
“We really do want to improve air quality and so we really do need to get the correct evidence behind it.”
Conclusion: Difficult to quantify if Mpumalanga is world’s biggest polluter from the methods used by Greenpeace.
In a widely-reported statement, the environmental group Greenpeace said South Africa’s Mpumalanga province was the world’s largest “air pollution hotspot”.
It however said this was only for nitrogen dioxide, basing the conclusion on its “groundbreaking analysis” of new satellite data.
But experts said Mpumalanga’s air pollution problem has been known for years. What is new is that more detailed imagery is now available.
A number of problems with Greenpeace’s analysis were cited. These include equating aerial emissions with ground level concentrations, comparing different global peak emission periods and the use of an arbitrary distance to define a hotspot.
Official data shows the ground level concentrations stipulated by law for nitrogen dioxide have so far not been exceeded since 2010.
While air pollution in Mpumalanga is rightly of national concern, using accurate evidence will help ensure scarce resources are spent in the best way possible to improve air quality.
Further reading:
https://africacheck.org/2018/08/22/analysis-can-we-tell-which-african-cities-have-the-most-polluted-air/

Add new comment