
This article is more than 5 years old
South Africa’s official opposition party, the Democratic Alliance (DA), launched its election manifesto in Johannesburg on 23 February 2019. The country’s national and provincial elections will be held on 8 May.
Taglined “one South Africa for all”, the manifesto contains a number of claims about the state of the country.
This report fact-checks five claims about jobs, unemployment, health facilities and land reform in South Africa.
The National Youth Commission Act defines the youth as people “between the ages of 14 and 35”.
But Statistics South Africa’s Quarterly Labour Force Survey does not collect data on 14-year-olds.
And according to the agency’s acting chief director for labour statistics, Malerato Mosiane, “benchmarking is done using five-year age groups, so the 35-year-olds will be in the 35- to 39-year age group”.
Mosiane said the unemployment rate for people aged 15 to 34 was 38.7% in the fourth quarter of 2018 – the latest available data.
This is according to the official definition of “unemployed”: people without work who are still looking for work or trying to start a business.
Using the expanded definition – which includes people who are not actively looking for work – half (50.1%) were unemployed, Mosiane said.
In its 2019 election manifesto, the DA claims that South Africa’s youth unemployment is among the highest in the world.
But different countries use different definitions of “youth”.
And comparing unemployment in different countries is also complicated by factors such as different data collection methods.
The DA said it based its claim on British news magazine the Economist’s Pocket World in Figures, which ranked South Africa first for youth unemployment.
“However, these stats were based on 2017 numbers, which is why the statement in our manifesto places South Africa amongst others globally with high youth unemployment statistics,” DA spokesperson Solly Malatsi told Africa Check.
“As employment stats are highly dynamic it is not inconceivable that countries could move a rank or two depending on labour market shocks.”
The UN defines the youth as people between the ages of 15 and 24 years.
The International Labour Organization, a UN agency, provides data for this age group in 189 countries, territories and areas.
In its 2018 estimates, South Africa had the highest unemployment rate for 15-to-24-year-olds. Neighbouring Namibia and eSwatini ranked in sixth and seventh place.
Source: International Labour Organization
Note: Numbers are rounded off.
There are many reasons for South Africa’s high youth unemployment, and many of them are connected. That’s according to Ariane De Lannoy, associate professor in the Southern Africa Labour and Development Research Unit at the University of Cape Town.
Down at the household level, De Lannoy said, South Africa’s past – where the education system and labour market discriminated against black people – lives on. “We have young people that live in households where no one else is employed.”
As a result, they may struggle to come to grips with the job market.
At level of the country as a whole, the education system doesn’t provide the advanced skills required by the labour market, she said.
A recently released report on youth unemployment by the Centre for Development and Enterprise also says the education system is an underlying cause of youth unemployment.
The report identifies other contributing factors:
De Lannoy, who co-authored a 2018 review of hundreds of journal articles and government documents related to youth unemployment, said there wasn’t a “single, simple” solution to the problem.
It should be tackled by society as a whole – by the government, businesses and other employers, as well as by communities, where people could help each other get access to knowledge and opportunities.
While country comparisons of youth unemployment data have limitations, the available data does put South Africa among the worst performers.
As testament to its achievements, the DA claimed that “50% of all new jobs in South Africa, in the past year, were created in the Western Cape”.
The manifesto, released on 23 February 2019, said these jobs had been created between the third quarter of 2017 (July to September) and the third quarter of 2018.
The DA was elected as the Western Cape’s government in May 2009.
Statistics South Africa’s Quarterly Labour Force Survey for the third quarter of 2018 shows that 95,000 net jobs were created in the Western Cape in the previous year. A total of 188,000 net jobs were created countrywide. (Note: Net jobs are job gains minus job losses.)
The DA’s claim is therefore correct for the period between Q3 2017 and Q3 2018.
Source: Stats SA (Note: Due to rounding, numbers do not necessarily add up to totals.)
Stats SA previously told Africa Check that this kind of calculation “may be confusing”. But Yves Perardel, a statistician at the International Labour Organization, told Africa Check that the DA’s calculation was methodologically correct.
“This is a standard approach globally,” he said.
The DA’s claim is correct for the period given. But when the party released its manifesto, more recent data was available. Stats SA released figures for the fourth quarter of 2018 on 12 February 2019.
This more recent data shows that 358,000 jobs were created in South Africa between the fourth quarter of 2017 and the fourth quarter of 2018. But only 29,000 of these jobs were created in the Western Cape.
This is 8.1% of all jobs created in the last year, significantly lower than the 50% claimed by the DA.
Source: Stats SA (Note: Due to rounding, numbers do not necessarily add up to totals.)
The largest share of net jobs were created in Gauteng (48%), followed by KwaZulu-Natal (37.7%), Limpopo (16.5%) and the Western Cape (8.1%).
The DA continues to make the claim as the election approaches, despite more recent data being available.
On 26 April 2019, the party tweeted that “more than half of all new jobs created in [South Africa] in the last financial year were created in the [Western Cape]”.
“It is important to use the latest data when your purpose is to describe the most up-to-date situation in the labour market,” Morné Oosthuizen, deputy director of the Development Policy Research Unit at the University of Cape Town, told Africa Check.
“That way, you can be reasonably confident that the current situation is not materially different from the situation you might have described using older data.”
But if the purpose was to show how well the provincial economy had been managed, it would have been better to use data covering a longer time period, Oosthuizen said. This way, the DA could have avoided being accused of cherry picking, he added.
“It is important to remember that local and provincial economies, while all exposed to the same forces in terms of things like exchange rates... may react slightly differently to these same forces”. They had their own unique characteristics, weather conditions and labour market dynamics, Oosthuizen said.
A province may see rapid jobs growth in one quarter and may seem responsible for a large share of the total increase in employment, but this can easily be reversed in the next quarter.
“As an example, in periods where mining has done particularly poorly and has shed jobs rapidly, the Western Cape is typically shielded from the type of job losses observed in provinces where mining is more important,” Oosthuizen said.
“When mining recovers and adds jobs, the situation may be reversed.”
Dr Neva Makgetla, senior economist at Trade and Industrial Policy Studies, told Africa Check that job creation was largely driven by “national and international conditions and national policies”.
“The Western Cape inherited the best infrastructure in the country plus none of the former so-called ‘homelands’, so they started with a far lower jobless rate and a much more dynamic economy.”
The DA relied on outdated data when it claimed that “50% of all new jobs in South Africa, in the past year, were created in the Western Cape.” The most recent data shows that the province accounted for 8% of net jobs between the fourth quarters of 2017 and 2018. - Cayley Clifford (4 May 2019)
Note: Africa Check offered the DA the opportunity to comment on this fact-check prior to publication. Their response, provided after our deadline, can be read here.
The ratio in this claim does not reflect the current situation because it is based on numbers that date from the year of the previous general election.
DA spokesperson Solly Malatsi told us that the statistic was contained in the 2017 South African Survey by the South African Institute of Race Relations (SAIRR).
According to the health chapter of this report, South Africa had 3,182 public clinics in 2014.
The SAIRR, in turn, sourced this number from the work of the Health Systems Trust, a nonprofit organisation that specialises in health research.
The most recent edition of the SA Health Review from the Health Systems Trust puts the number of public clinics in March last year at 3,187 – only five more than in 2014. But because of the increase in the population size since 2014, the ratio in the claim is out of date.
Based on Stats SA’s mid-year population estimates, South Africa had 57.73 million residents last year. This would mean that there was one clinic for every 18,114 people at the time.
Candy Day, technical specialist at the Health Systems Trust, told Africa Check/City Press that the number of clinics cited in the SA Health Review applied to government-operated clinics (not private clinics) and excluded mobile and satellite clinics.
She said the source of the count was the District Health Information System, which is used by the national and provincial departments of health, and contains a categorisation of health facilities.
“In general, we do our best to provide the summary statistics, but, as with all data, there are many nuances and areas where errors or interpretation can arise,” she said.
The spokesperson for the department of health, Popo Maja, told us there were currently 5,211 primary healthcare delivery points, of which 3,190 were clinics.
He said population wasn’t the only determinant of where and how many healthcare facilities government provides. In some cases, the ratio of facilities to people would be “irrelevant”.
Maja gave the example of the sparsely populated Northern Cape, where a small community of about 1,000 people would need access to a primary healthcare facility.
Conversely, he said, it was “not feasible” to have a facility every 2km2 in densely populated areas like Soweto in Gauteng.
“In these cases, you would have primary healthcare service delivery facilities that would have up to 30 consulting rooms to enable the provision of services to the catchment population.”
The DA also claims that the country’s clinic-to-person ratio falls short of a World Health Organization (WHO) guideline of 1:10,000.
However, the document the party provided in support of this only states that the number and distribution of health facilities per 10,000 people is a core indicator for monitoring service delivery.
We were unable to find a WHO representative who was aware of the existence of the purported guideline for clinics cited by the DA in its manifesto.
While the number of public clinics used to calculate the ratio closely matches the current figure provided by the department of health, the DA relied on an outdated population size. The most recent data show that there was one clinic for every 18,114 people last year.
In this case, the DA relied on a statement made by African National Congress veteran Mathews Phosa, according to DA spokesperson Solly Malatsi.
In 2017, Phosa reportedly said that “up to 90% of land reform projects are unsuccessful”.
We asked Phosa, through his office manager, what he had based his statement on, but received no response by the time of publication.
Phosa was, however, not the first to make a claim about a land reform failure rate of about 90%.
In 2010, then minister of rural development and land reform Gugile Nkwinti said at a briefing: “We have not talked about the revenue which the state has lost because 5.9 million hectares of farms that were active and acquiring revenue for the state were handed over to people, and more than 90% of those are not functional – they are not productive and therefore the state loses revenue.”
However, Professor Ben Cousins of the Institute for Poverty, Land and Agrarian Studies (Plaas) at the University of the Western Cape told Africa Check/City Press that, at the time, Nkwinti’s claim was not backed by research, and the same is true for the DA’s current claim.
Asked how the party defined success, Malatsi said it applied to land redistribution projects where “beneficiaries have managed to create economically viable businesses once land has been redistributed”.
He added that, “upon reflection”, it appeared that the actual failure rate, based on Phosa’s claim, was 90% instead of 92%, but the party believed the “overall narrative remains correct”.
The DA conceded however that, outside of the completion rate for land restitution claims, “there has been no attempt by the national government to conduct a proper audit into the success or failure of land reform projects”.
“Defining success and failure depends on the measure you use to assess impact,” stated a 2013 Plaas fact-check on the extent to which land reform projects had improved beneficiaries’ income and livelihoods.
Cousins said, “around 50% of the projects have improved the livelihoods of beneficiaries to a degree”.
This number, he told us, was a “rough estimate” in the absence of more reliable data. It is based on research published between 2005 and 2013, including:
We asked the department of rural development and land reform for its research on the success of land reform projects but did not receive a response by the deadline. In a parliamentary reply to a DA question, dated October 2018, the current minister said the department was not aware of the failure rate of 92%.
The DA’s claim is based on an untested statement made by Mathews Phosa. The party stated the failure rate as a fact despite knowing that there was no “proper” national audit on the success of land reform projects in South Africa. Currently, there is no research that supports or disproves the claim.
The audit, which covered the four years from April 1 2009 to March 31 2013, set out to determine whether a sample of land reform projects in the province was successful.
DA spokesperson Solly Malatsi told us the latest audit report, covering 2014 to this year, was not available when the manifesto was compiled.
The 135 projects that were rated as successful or unsuccessful represented just more than half of the 246 provincial projects assisted through two farmer-support programmes.
These programmes – the Comprehensive Agricultural Support Programme and Ilima/Letsema – are funded by the national government and implemented by provinces.
Eighty-four of the projects were deemed successful as they scored between 53% and 100% based on 39 criteria. These included the ability to feed the household, whether the project was viable or profitable and whether the farm was used to its full potential.
“Successful” projects made up 62% of the sample of 135 and not of all supported projects.
What proportion the 135 rated projects make up of all land reform farms in the province is not known.
As the DA’s claim relates to farms and not projects, we asked the Western Cape government if the two were synonymous.
Bianca Capazorio, spokesperson for the province's head of economic opportunities (which includes agriculture), said: “Technically, they are not the same thing. A land reform project is a project that is on a land reform farm."
“However, there are instances in the province where there is more than one farmer on a land reform farm, and they are deemed to be two separate entities.”
Capazorio could not say whether the 246 projects from which the sample was selected represented all land reform farms in the province at the time.
“We simply don’t know and we believe that the department of rural development and land reform doesn’t have sufficient data on the numbers either. The 246 on our list are either farms that we have been alerted to by the department, or are farms we have supported or that have approached us for support.”
She could also not say how many land reform farms had been redistributed in the province since 1994, saying that land reform was the mandate of the department of rural development and land reform, which “is also the record keeper”.
The summary report on the audit, by urban and rural development planning company Kayamandi Development Services, identifies commodity support as a contributing factor to the success of land reform in the province. However, no mention is made of equity share schemes, which was a key success factor mentioned in the DA’s claim.
A comparison of the provincial delivery of land reform and agricultural support services by Plaas points out that the definition of success in the Western Cape audit is not linked to a national standard or policy, and that there “are no similar studies nationally with which to compare the findings”.
Yet the DA goes on to draw a direct comparison in its manifesto between the 62% of selected projects that were found to be successful in the provincial audit and an untested claim reportedly made by African National Congress veteran Mathews Phosa in 2017, according to which “up to 90%” of land reform projects were unsuccessful.
Based on Phosa’s statement, the DA claimed that “the national government’s failure rate of land reform projects is currently standing at 92%”.
We asked the department of rural development and land reform for comment on the DA’s claim, but it did not respond by the time of publication.
The DA claims that 62% of “all” land reform farms in the Western Cape are successful. However, the audit on which the claim is based did not review all land reform farms in the province. In fact, the provincial government does not know how many land reform farms there are. The 62% only applies to 135 projects and to a period of four years. Furthermore, the definition of success applied in the manifesto is not standardised.
Taglined “one South Africa for all”, the manifesto contains a number of claims about the state of the country.
This report fact-checks five claims about jobs, unemployment, health facilities and land reform in South Africa.
The National Youth Commission Act defines the youth as people “between the ages of 14 and 35”.
But Statistics South Africa’s Quarterly Labour Force Survey does not collect data on 14-year-olds.
And according to the agency’s acting chief director for labour statistics, Malerato Mosiane, “benchmarking is done using five-year age groups, so the 35-year-olds will be in the 35- to 39-year age group”.
Mosiane said the unemployment rate for people aged 15 to 34 was 38.7% in the fourth quarter of 2018 – the latest available data.
This is according to the official definition of “unemployed”: people without work who are still looking for work or trying to start a business.
Using the expanded definition – which includes people who are not actively looking for work – half (50.1%) were unemployed, Mosiane said.
How does South Africa compare?
In its 2019 election manifesto, the DA claims that South Africa’s youth unemployment is among the highest in the world.
But different countries use different definitions of “youth”.
And comparing unemployment in different countries is also complicated by factors such as different data collection methods.
The DA said it based its claim on British news magazine the Economist’s Pocket World in Figures, which ranked South Africa first for youth unemployment.
“However, these stats were based on 2017 numbers, which is why the statement in our manifesto places South Africa amongst others globally with high youth unemployment statistics,” DA spokesperson Solly Malatsi told Africa Check.
“As employment stats are highly dynamic it is not inconceivable that countries could move a rank or two depending on labour market shocks.”
The UN defines the youth as people between the ages of 15 and 24 years.
The International Labour Organization, a UN agency, provides data for this age group in 189 countries, territories and areas.
In its 2018 estimates, South Africa had the highest unemployment rate for 15-to-24-year-olds. Neighbouring Namibia and eSwatini ranked in sixth and seventh place.
| 10 countries with the highest youth unemployment rates in 2018 | |
| Country/territory/area | Unemployment rate (%) |
| South Africa | 53 |
| Occupied Palestinian Territory | 47 |
| Bosnia and Herzegovina | 47 |
| Saint Lucia | 45 |
| North Macedonia | 45 |
| Namibia | 44 |
| Eswatini | 44 |
| Libya | 42 |
| Saint Vincent and the Grenadines | 41 |
| Greece | 40 |
Source: International Labour Organization
Note: Numbers are rounded off.
Why so high?
There are many reasons for South Africa’s high youth unemployment, and many of them are connected. That’s according to Ariane De Lannoy, associate professor in the Southern Africa Labour and Development Research Unit at the University of Cape Town.
Down at the household level, De Lannoy said, South Africa’s past – where the education system and labour market discriminated against black people – lives on. “We have young people that live in households where no one else is employed.”
As a result, they may struggle to come to grips with the job market.
At level of the country as a whole, the education system doesn’t provide the advanced skills required by the labour market, she said.
A recently released report on youth unemployment by the Centre for Development and Enterprise also says the education system is an underlying cause of youth unemployment.
The report identifies other contributing factors:
- The small difference between minimum wages and median wages, which discourages companies from employing people without experience. “Why do so, when an experienced worker costs about the same amount?”
- “Too many South Africans live in places where it is hard to find a job or expensive to get to and from work.”
De Lannoy, who co-authored a 2018 review of hundreds of journal articles and government documents related to youth unemployment, said there wasn’t a “single, simple” solution to the problem.
It should be tackled by society as a whole – by the government, businesses and other employers, as well as by communities, where people could help each other get access to knowledge and opportunities.
Verdict: Correct
While country comparisons of youth unemployment data have limitations, the available data does put South Africa among the worst performers.
As testament to its achievements, the DA claimed that “50% of all new jobs in South Africa, in the past year, were created in the Western Cape”.
The manifesto, released on 23 February 2019, said these jobs had been created between the third quarter of 2017 (July to September) and the third quarter of 2018.
The DA was elected as the Western Cape’s government in May 2009.
Statistics South Africa’s Quarterly Labour Force Survey for the third quarter of 2018 shows that 95,000 net jobs were created in the Western Cape in the previous year. A total of 188,000 net jobs were created countrywide. (Note: Net jobs are job gains minus job losses.)
The DA’s claim is therefore correct for the period between Q3 2017 and Q3 2018.
| Net provincial changes in employment between Q3 2017 and Q3 2018 | ||
| Province | Nett jobs | Contribution |
| Western Cape | 95,000 | 50.5% |
| Limpopo | 26,000 | 13.8% |
| KwaZulu-Natal | 98,000 | 52.1% |
| Free State | -48,000 | -25.5% |
| Northern Cape | 16,000 | 8.5% |
| North West | -4,000 | -2.1% |
| Mpumalanga | 27,000 | 14.4% |
| Eastern Cape | -31,000 | -16.5% |
| Gauteng | 9,000 | 4.8% |
| Total | 188,000 | 100% |
Source: Stats SA (Note: Due to rounding, numbers do not necessarily add up to totals.)
Stats SA previously told Africa Check that this kind of calculation “may be confusing”. But Yves Perardel, a statistician at the International Labour Organization, told Africa Check that the DA’s calculation was methodologically correct.
“This is a standard approach globally,” he said.
DA used old data
The DA’s claim is correct for the period given. But when the party released its manifesto, more recent data was available. Stats SA released figures for the fourth quarter of 2018 on 12 February 2019.
This more recent data shows that 358,000 jobs were created in South Africa between the fourth quarter of 2017 and the fourth quarter of 2018. But only 29,000 of these jobs were created in the Western Cape.
This is 8.1% of all jobs created in the last year, significantly lower than the 50% claimed by the DA.
| Net provincial changes in employment between Q4 2017 and Q4 2018 | ||
| Province | Net jobs | Contribution |
| Western Cape | 29,000 | 8.1% |
| Limpopo | 59,000 | 16.5% |
| KwaZulu-Natal | 135,000 | 37.7% |
| Free State | 1,000 | 0.3% |
| Northern Cape | 0 | 0.0% |
| North West | -27,000 | -7.5% |
| Mpumalanga | 3,000 | 0.8% |
| Eastern Cape | -16,000 | -4.5% |
| Gauteng | 172,000 | 48.0% |
| Total | 358,000 | 100% |
Source: Stats SA (Note: Due to rounding, numbers do not necessarily add up to totals.)
The largest share of net jobs were created in Gauteng (48%), followed by KwaZulu-Natal (37.7%), Limpopo (16.5%) and the Western Cape (8.1%).
Important to use latest data
The DA continues to make the claim as the election approaches, despite more recent data being available.
On 26 April 2019, the party tweeted that “more than half of all new jobs created in [South Africa] in the last financial year were created in the [Western Cape]”.
“It is important to use the latest data when your purpose is to describe the most up-to-date situation in the labour market,” Morné Oosthuizen, deputy director of the Development Policy Research Unit at the University of Cape Town, told Africa Check.
“That way, you can be reasonably confident that the current situation is not materially different from the situation you might have described using older data.”
But if the purpose was to show how well the provincial economy had been managed, it would have been better to use data covering a longer time period, Oosthuizen said. This way, the DA could have avoided being accused of cherry picking, he added.
Provincial economies have unique characteristics
“It is important to remember that local and provincial economies, while all exposed to the same forces in terms of things like exchange rates... may react slightly differently to these same forces”. They had their own unique characteristics, weather conditions and labour market dynamics, Oosthuizen said.
A province may see rapid jobs growth in one quarter and may seem responsible for a large share of the total increase in employment, but this can easily be reversed in the next quarter.
“As an example, in periods where mining has done particularly poorly and has shed jobs rapidly, the Western Cape is typically shielded from the type of job losses observed in provinces where mining is more important,” Oosthuizen said.
“When mining recovers and adds jobs, the situation may be reversed.”
Dr Neva Makgetla, senior economist at Trade and Industrial Policy Studies, told Africa Check that job creation was largely driven by “national and international conditions and national policies”.
“The Western Cape inherited the best infrastructure in the country plus none of the former so-called ‘homelands’, so they started with a far lower jobless rate and a much more dynamic economy.”
Verdict: Misleading
The DA relied on outdated data when it claimed that “50% of all new jobs in South Africa, in the past year, were created in the Western Cape.” The most recent data shows that the province accounted for 8% of net jobs between the fourth quarters of 2017 and 2018. - Cayley Clifford (4 May 2019)
Note: Africa Check offered the DA the opportunity to comment on this fact-check prior to publication. Their response, provided after our deadline, can be read here.
The ratio in this claim does not reflect the current situation because it is based on numbers that date from the year of the previous general election.
DA spokesperson Solly Malatsi told us that the statistic was contained in the 2017 South African Survey by the South African Institute of Race Relations (SAIRR).
According to the health chapter of this report, South Africa had 3,182 public clinics in 2014.
The SAIRR, in turn, sourced this number from the work of the Health Systems Trust, a nonprofit organisation that specialises in health research.
The most recent edition of the SA Health Review from the Health Systems Trust puts the number of public clinics in March last year at 3,187 – only five more than in 2014. But because of the increase in the population size since 2014, the ratio in the claim is out of date.
Based on Stats SA’s mid-year population estimates, South Africa had 57.73 million residents last year. This would mean that there was one clinic for every 18,114 people at the time.
What is a clinic?
Candy Day, technical specialist at the Health Systems Trust, told Africa Check/City Press that the number of clinics cited in the SA Health Review applied to government-operated clinics (not private clinics) and excluded mobile and satellite clinics.
She said the source of the count was the District Health Information System, which is used by the national and provincial departments of health, and contains a categorisation of health facilities.
“In general, we do our best to provide the summary statistics, but, as with all data, there are many nuances and areas where errors or interpretation can arise,” she said.
Population not the only consideration
The spokesperson for the department of health, Popo Maja, told us there were currently 5,211 primary healthcare delivery points, of which 3,190 were clinics.
He said population wasn’t the only determinant of where and how many healthcare facilities government provides. In some cases, the ratio of facilities to people would be “irrelevant”.
Maja gave the example of the sparsely populated Northern Cape, where a small community of about 1,000 people would need access to a primary healthcare facility.
Conversely, he said, it was “not feasible” to have a facility every 2km2 in densely populated areas like Soweto in Gauteng.
“In these cases, you would have primary healthcare service delivery facilities that would have up to 30 consulting rooms to enable the provision of services to the catchment population.”
‘The WHO guideline’
The DA also claims that the country’s clinic-to-person ratio falls short of a World Health Organization (WHO) guideline of 1:10,000.
However, the document the party provided in support of this only states that the number and distribution of health facilities per 10,000 people is a core indicator for monitoring service delivery.
We were unable to find a WHO representative who was aware of the existence of the purported guideline for clinics cited by the DA in its manifesto.
Verdict: Incorrect
While the number of public clinics used to calculate the ratio closely matches the current figure provided by the department of health, the DA relied on an outdated population size. The most recent data show that there was one clinic for every 18,114 people last year.
In this case, the DA relied on a statement made by African National Congress veteran Mathews Phosa, according to DA spokesperson Solly Malatsi.
In 2017, Phosa reportedly said that “up to 90% of land reform projects are unsuccessful”.
We asked Phosa, through his office manager, what he had based his statement on, but received no response by the time of publication.
Phosa was, however, not the first to make a claim about a land reform failure rate of about 90%.
In 2010, then minister of rural development and land reform Gugile Nkwinti said at a briefing: “We have not talked about the revenue which the state has lost because 5.9 million hectares of farms that were active and acquiring revenue for the state were handed over to people, and more than 90% of those are not functional – they are not productive and therefore the state loses revenue.”
However, Professor Ben Cousins of the Institute for Poverty, Land and Agrarian Studies (Plaas) at the University of the Western Cape told Africa Check/City Press that, at the time, Nkwinti’s claim was not backed by research, and the same is true for the DA’s current claim.
Asked how the party defined success, Malatsi said it applied to land redistribution projects where “beneficiaries have managed to create economically viable businesses once land has been redistributed”.
He added that, “upon reflection”, it appeared that the actual failure rate, based on Phosa’s claim, was 90% instead of 92%, but the party believed the “overall narrative remains correct”.
The DA conceded however that, outside of the completion rate for land restitution claims, “there has been no attempt by the national government to conduct a proper audit into the success or failure of land reform projects”.
What is successful land reform?
“Defining success and failure depends on the measure you use to assess impact,” stated a 2013 Plaas fact-check on the extent to which land reform projects had improved beneficiaries’ income and livelihoods.
Cousins said, “around 50% of the projects have improved the livelihoods of beneficiaries to a degree”.
This number, he told us, was a “rough estimate” in the absence of more reliable data. It is based on research published between 2005 and 2013, including:
- A review of 43 land reform projects in North West, published in 2005, found that production was stable or had increased in 56% of cases.
- In a 2008 national survey of Land Redistribution for Agricultural Development projects (2001 to 2006), 49% were identified as stable or showing improvement, according to the above-mentioned Plaas fact check.
- A project census of 117 redistribution and restitution projects in the Vhembe and Capricorn districts of Limpopo showed evidence of activity (some production, leasing or joint ventures) in 44% of cases. The research was done from 2007 and the results were published in 2013.
We asked the department of rural development and land reform for its research on the success of land reform projects but did not receive a response by the deadline. In a parliamentary reply to a DA question, dated October 2018, the current minister said the department was not aware of the failure rate of 92%.
Verdict: Unproven
The DA’s claim is based on an untested statement made by Mathews Phosa. The party stated the failure rate as a fact despite knowing that there was no “proper” national audit on the success of land reform projects in South Africa. Currently, there is no research that supports or disproves the claim.
The audit, which covered the four years from April 1 2009 to March 31 2013, set out to determine whether a sample of land reform projects in the province was successful.
DA spokesperson Solly Malatsi told us the latest audit report, covering 2014 to this year, was not available when the manifesto was compiled.
The 135 projects that were rated as successful or unsuccessful represented just more than half of the 246 provincial projects assisted through two farmer-support programmes.
These programmes – the Comprehensive Agricultural Support Programme and Ilima/Letsema – are funded by the national government and implemented by provinces.
Eighty-four of the projects were deemed successful as they scored between 53% and 100% based on 39 criteria. These included the ability to feed the household, whether the project was viable or profitable and whether the farm was used to its full potential.
“Successful” projects made up 62% of the sample of 135 and not of all supported projects.
What proportion the 135 rated projects make up of all land reform farms in the province is not known.
How many land reform farms?
As the DA’s claim relates to farms and not projects, we asked the Western Cape government if the two were synonymous.
Bianca Capazorio, spokesperson for the province's head of economic opportunities (which includes agriculture), said: “Technically, they are not the same thing. A land reform project is a project that is on a land reform farm."
“However, there are instances in the province where there is more than one farmer on a land reform farm, and they are deemed to be two separate entities.”
Capazorio could not say whether the 246 projects from which the sample was selected represented all land reform farms in the province at the time.
“We simply don’t know and we believe that the department of rural development and land reform doesn’t have sufficient data on the numbers either. The 246 on our list are either farms that we have been alerted to by the department, or are farms we have supported or that have approached us for support.”
She could also not say how many land reform farms had been redistributed in the province since 1994, saying that land reform was the mandate of the department of rural development and land reform, which “is also the record keeper”.
The summary report on the audit, by urban and rural development planning company Kayamandi Development Services, identifies commodity support as a contributing factor to the success of land reform in the province. However, no mention is made of equity share schemes, which was a key success factor mentioned in the DA’s claim.
‘Not comparable’
A comparison of the provincial delivery of land reform and agricultural support services by Plaas points out that the definition of success in the Western Cape audit is not linked to a national standard or policy, and that there “are no similar studies nationally with which to compare the findings”.
Yet the DA goes on to draw a direct comparison in its manifesto between the 62% of selected projects that were found to be successful in the provincial audit and an untested claim reportedly made by African National Congress veteran Mathews Phosa in 2017, according to which “up to 90%” of land reform projects were unsuccessful.
Based on Phosa’s statement, the DA claimed that “the national government’s failure rate of land reform projects is currently standing at 92%”.
We asked the department of rural development and land reform for comment on the DA’s claim, but it did not respond by the time of publication.
Verdict: Misleading
The DA claims that 62% of “all” land reform farms in the Western Cape are successful. However, the audit on which the claim is based did not review all land reform farms in the province. In fact, the provincial government does not know how many land reform farms there are. The 62% only applies to 135 projects and to a period of four years. Furthermore, the definition of success applied in the manifesto is not standardised.
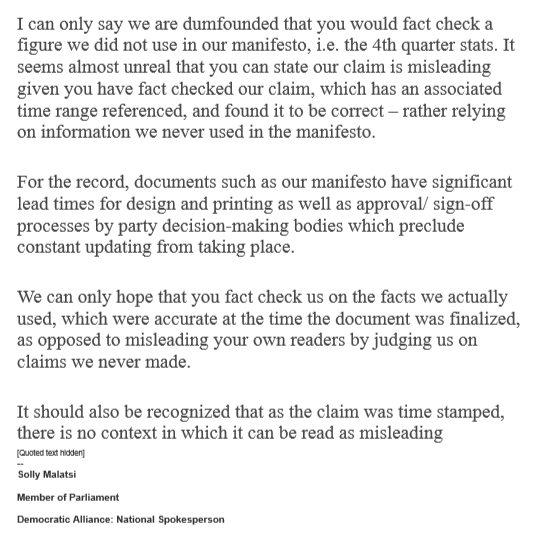
| Manifesto research ‘within reasonable accuracy’ – DA Asked to comment on our findings, DA spokesperson Solly Malatsi, said: “The Democratic Alliance notes the findings by Africa Check on the party’s Manifesto for Change. The manifesto underwent a vigorous research and consultation process in order to ensure that we can deliver the best offer to the people of South Africa. Where we govern, we have a proven track record of success in both healthcare and land reform. This is because we understand that when it comes to healthcare and land reform, our people deserve dignity and justice. We are confident that all the information from the research into the manifesto is within reasonable accuracy.” |
| CORRECTION: This report previously stated that the Free State province added 1 job between Q4 2017 and Q4 2018. The correct figure is 1,000. We apologise for the error. |


Add new comment