This article is more than 6 years old
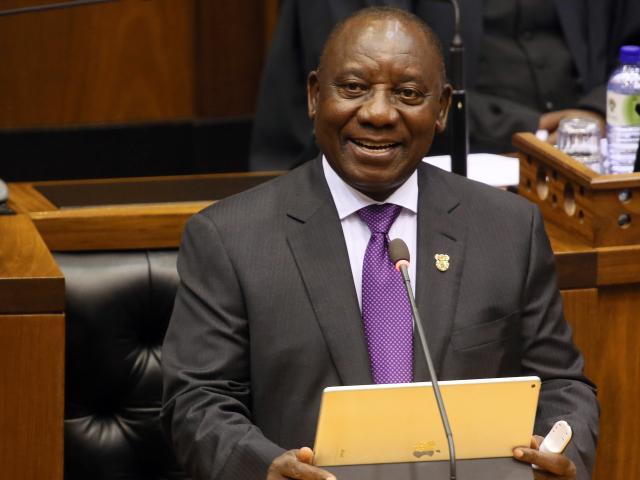
South Africa's parliament squeezed in the debate on the State of the Nation address as well as the president's reply before the budget speech is set to be delivered. Here we verify key claims made by members of parliament as they reflected on newly-elected President Cyril Ramphosa's maiden address.
The Democratic Alliance’s (DA) George Michalakis pointed out that while the Western Cape province has high levels of violence, it has the lowest unemployment rate in the country.
"This is a strange paradox. Lower unemployment should lead to lower crime stats,” he said.
Data from the quarterly labour force survey released by Statistics South Africa last week shows that Michalakis is right about the unemployment rate. In the last quarter of 2017, it had both the lowest narrow and lowest broad unemployment rate (the second rate includes people who had given up looking for a job).
This means that Tsapane Kgwedi Mampuru, who represents the ANC in the National Council of Provinces, was incorrect when later in the debate she said: “I must indicate upfront that Limpopo province has the lowest unemployment rate in the country at 20.8%.” (Note: That was Limpopo's narrow unemployment rate in the second quarter of 2017, but also then the Western Cape's rate was slightly lower at 20.7%.) - Ina Skosana
| Province | Narrow unemployment rate | Expanded unemployment rate |
| Western Cape | 19.5% | 23.0% |
| Limpopo | 19.6% | 36.8% |
| North West | 23.9% | 40.6% |
| KwaZulu-Natal | 24.1% | 41.0% |
| Northern Cape | 27.1% | 40.5% |
| Mpumalanga | 28.9% | 39.7% |
| Gauteng | 29.1% | 33.7% |
| Free State | 32.6% | 39.0% |
| Eastern Cape | 35.1% | 44.8% |
Source: Stats SA
In response to the DA’s boast about the Western Cape province’s low unemployment rate, the ANC’s Richard Dyantyi claimed that the province’s economic performance “excludes the vulnerable people of the Western Cape”, with the bulk of unemployed people being youth.
(Note: Dyantyi also claimed the Western Cape hadn’t employed young people as part of the national department’s War on Leaks programme, but Africa Check was unable to confirm this with departmental spokesman Sputnik Ratau or Asief Alli, the programme manager for the Rand Water Academy.)
In the last three months of 2017, the province had an estimated 603,000 unemployed people who were actively looking for a job, according to Stats SA most recent employment survey. Of those, the bulk (378,000 people, or 62.7%) were youth between the ages of 15 and 34, as Dyantyi had said.
But the picture was similar at the national level, with youth making up 63.9% of the country’s 5,880,000 unemployed people.
'Back of the labour market queue'
These ratios were much the same for the broad unemployment rate, which includes people “we term ‘discouraged work seekers’ – those who have not looked for work in the 4 weeks preceding the survey”, Lauren Graham told Africa Check. She is deputy director at the University of Johannesburg’s Centre for Social Development.
“They may not have looked for work for a range of reasons, including not having the funds to look for work and having given up looking for work over that time.”
Stats SA data for broad unemployment in the Western Cape indicated that, of the 744,000 broadly unemployed people in the Western Cape, 466,000 were youth between the ages of 15-34. At the national level, 5,888,000 of the 9,216,000 broadly unemployed people were in that age group during October to December 2017.
There are a number of factors that drive South Africa’s high youth unemployment rate, said Graham said, including slow economic growth.
“[Y]outh tend to be at the back of the labour market queue because they are coming in with very little experience, and many of them coming in with very little training. We also know that when jobs are shed, young people are the first to lose jobs and they are the last to recover, so that drives the higher rates of unemployment for young people.” - Ina Skosana
Leader of the Freedom Front Plus, Pieter Groenewald, drew attention to the difference in university graduates by race group in South Africa.
The latest data from the Center for Higher Education Transformation shows that there were a total of 39,344 white university graduates in 2015 (at all levels). The number of black graduates was 3.2 times higher at 127,237.
The data supports Groenewald’s claim. However, white university students are more likely to complete their studies compared to black students.
A study by the University of Stellenbosch tracked South Africa’s 2008 matriculants for six years. Researchers used this data to calculate “throughput rates” by race group. This refers to the proportion of students who started studying at university and completed their undergraduate studies.
The data shows that “72% of white university participants who enrolled in 2009 had successfully completed their undergraduate qualifications by the end of 2014”. This was the highest completion rate.
In comparison, 54% of black university students had completed their undergraduate qualification in the same time period. - Kate Wilkinson
FACTSHEET: How many South African students graduate?
Councillor Parks Tau, president of the South African Local Government Association, drew attention to the slice of national revenue that local government receives from treasury.
“We have raised an ongoing concern that… local government receives an average of 9% from the national fiscus,” he said.
Tau’s number is supported by the latest data from national treasury.
The department’s 2017 budget review shows that local government received 8.9% of nationally-raised revenue in 2016/17. In comparison, provinces received 43.1%.
It’s important to note, however, that municipalities are expected to fund most of their own administrative costs. According to treasury, “the constitution gives local government substantial revenue-raising powers” such as property rates and charges for the provision of basic services. These avenues for revenue collection are not available to provinces.
But the ability to gather revenue differs from municipality to municipality, according to local government expert Andrew Siddle.
“The large metros will generally raise the great bulk of their own resources. As you get to smaller and smaller municipalities, their ability to do so decreases,” Siddle explained.
“Some municipalities have almost non-existent revenue bases, for example places out in the sticks where you have property values of no great significance and very small populations. There is nothing from which they can derive adequate revenue from.”
To account for this, the allocation of money to municipalities is adjusted by treasury. This means more resources go to poorer municipalities to account for the lower revenue they are able to collect in comparison to wealthier municipalities. - Kate Wilkinson
Leaning on the national assembly’s podium and lowering her voice, it looked like ANC MP Joanmariae Fubbs was about to confess a secret.
“We have a comparative advantage,” she said about South Africa’s tourism industry. “We have the most beautiful country and the most hospitable people.”
By asking South Africans to “not only open their homes, but their hearts” to the world, the country could build on the 12.8% increase in tourist arrivals, the chair of the parliamentary committee on trade and industry claimed.
The latest available data from South Africa’s statistical bureau, Statistic South Africa, was released in July 2017 and provides data for 2016.
The tourism report indicates that in 2016, South Africa recorded receiving 10,044,163 tourists who stayed for at least one night. The previous year, a total of 8,903,773 tourists were recorded as having visited the country.
This is indeed a percentage increase of 12.8%, but between 2015 and 2016 and not 2016 to 2017, as Fubbs’ stated.
The bulk of tourists visiting the country came from neighbouring countries, with a total of 7,313,684 tourists (72.8%) from the SADC region. By far the majority of tourists in 2016 came for a holiday (9,706,602 or 96.6% of tourists). - Gopolang Makou
“It is a well-known fact, that inequalities persist in South Africa and that we boast the highest unemployment rate in the world,” ANC member of parliament Nocawe Mafu told the national assembly during her address.
At the time, Statistics South Africa’s most recent data showed that 26.7% of the workforce was unemployed during October to December of 2017. This refers to people who were unemployed and actively looking for work.
The broad unemployment rate - which includes those who were unemployed and had stopped looking for work - was 36.3%.
Palestine highest when claim made
Yves Perardel, a statistician at the International Labour Organization (ILO), told Africa Check that Palestine had the highest unemployment rate in the world when Mafu made the claim in February 2018.
“However, the controversial situation regarding the recognition of Palestine as a country could explain the claim that was made," he said.
The estimates have since been updated. They now show that South Africa’s neighbour, Lesotho, had the highest unemployment rate in 2018 at 28.5%. South Africa was in second place.
- Lesotho (28.5%)
- South Africa (27.4%)
- Occupied Palestinian Territory (26.8%)
- Eswatini (26.5%)
- Bosnia and Herzegovina (26.1%)
- Mozambique (24.9%)
Since South Africa was the country with the highest unemployment rate when the claim was made, we rate this it mostly correct. - Kate Wilkinson
READ: SA deputy president correct on country’s unemployment
Democratic Alliance member of parliament, Karen Jooste, drew attention to a number of social issues in her speech, including food security, social grants and poverty.
Jooste’s claim is supported by the latest poverty data from Stats SA. It shows that 30.4 million people lived below the upper-bound poverty line of R992 per month in 2015.
This is equal to 55.5% of the population - up from 53.2% in 2011. - Kate Wilkinson
FACTSHEET: South Africa’s official poverty numbers
The DA's Jooste spent a large portion of her allocated time highlighting food insecurity. Arguing that the current child support grant isn’t aligned “to what it actually costs to feed a child”, she claimed that “27% of children under the age of 5 are stunted - nearly 30% of boys and 25% of girls”.
Jooste told Africa Check that she received the information from a monthly statement compiled by the non-governmental organisation, Pietermaritzburg Agency for Community Social Action. We were unable to find the claim in the document provided, but we traced it to South Africa’s 2016 Demographic and Health Survey released last year.
The survey considered a child stunted or short for their age if they have a height-for-age ratio that measures two points lower than the median of children in the same age group.
The MP's claim is supported by the research. 27% of children under the age of 5 in South Africa were “considered short for their age” in 2016. One in three boys (30%) and 1 in 4 girls (25%) were estimated to be stunted. - Ina Skosana
(Note: Jooste also referred to a claim we fact-checked before that four children die daily of malnutrition. We found the total could sadly be higher as only deaths in health facilities are accurately captured.)
MP Jooste paid particular attention to the toll on women who prioritise their children’s nutrition over their own.
“Women are literally sacrificing their bodies by eating the leftovers of the little they have so that their children can eat better,” she stressed. “And the sad part about this is that this strategy is not even working.”
She continued that the “biggest cause of deaths amongst women is non-communicable diseases”. Non-communicable diseases, often referred to as “lifestyle diseases”, are the result of factors such as genetics, the environment and our behaviour. These include chronic condition such as cancers, cardiovascular diseases and diabetes.
Jooste told Africa Check that she sourced this claim from the most recent mortality and causes of death report. The report, released by Stats SA last year for 2015, lists diabetes as the leading cause of death among women, accounting for 7.1% of all female deaths in 2015.
But as we reported before, deaths certificates do not provide an accurate reflection of South Africa’s AIDS-related deaths, a communicable disease.
In the 2012 Burden of Disease study, which is the latest available, researchers from South Africa’s Medical Research Council found that deaths due to AIDS-related causes were often misclassified or undercounted.
Researchers adjusted the data for deficiencies and found that Aids-related causes were the leading cause of death among women, accounting for 30.2% of all deaths in 2012. - Ina Skosana
South Africa has made progress in reducing deaths due to AIDS-related illness and tuberculosis (TB). But ANC member of parliament Fish Mahlalela’s highlighted that the fight is far from over as the country has “the third highest incidence of TB in the world after India and China”.
Mahlalela attributed the claim to the World Health Organisation (WHO). The WHO defines incidence as the number of new cases of a disease reported in particular period of time.
Head of the Centre for Tuberculosis at the National Institute for Communicable Diseases, Nazir Ismail, told Africa Check that “South Africa has one of the highest burden in absolute numbers of estimated TB cases”.
When this measure is considered, South Africa had the 6th highest number of new cases in 2016, according to the WHO's most recent estimates.
“However, when adjusted for population size… then we have the highest incidence per 100,000 population,” Nazir explained.
South Africa’s incidence rate per 100,000 people was estimated at 781, compared to the next highest - Philippines - at 554.
| Country | New cases in 2016 | New cases per 100,000 |
| India | 2,790,000 | 211 |
| Indonesia | 1,020,000 | 391 |
| China | 895,000 | 64 |
| Philippines | 573,000 | 554 |
| Pakistan | 518,000 | 268 |
| South Africa | 438,000 | 781 |
Source: 2016 WHO estimates
ANC member of parliament, Amos Mahlalela, was speaking about the “rapidly growing rate of non-communicable diseases” when he made this claim about South Africa’s international ranking for obesity.
Obesity is measured using Body Mass Index (BMI), which takes into account how much a person weighs in relation to their height. When BMI is greater than or equal to 25, a person is classified as overweight. A BMI of over 30 means a person is obese. (Note: For instance, if you are 1.8 m tall man and weigh more than 81 kg, you would be considered overweight. If your weight tops 98 kg, you’re counted as obese.)
South Africa does have high levels of obesity. World Health Organisation data from 2016 showed that 28.3% of the adult population was classified as obese. However, Mahlalela is wrong to claim that South Africa is the “most obese country” in the world.
That unlucky title goes to the Pacific island of Nauru, where 61% of the adult population is obese. South Africa was tied in 30th place with Argentina.
READ: No, SA does not weigh in as the world’s 3rd most obese nation
“Mr President, you would have us believe that our basic education outcomes are improving, quoting the increase in matric pass rates,” DA member of parliament Yusuf Cassim said during the State of the Nation debate.
“The reality is that the real matric pass rate is at 37.3%. This is not an improvement.”
While South Africa’s 2017 matric pass rate was 75.1%, the DA has argued that the “real matric pass rate” is actually 37.3%. This figure represents the number of Grade 10 students in 2015 that went on to pass matric in 2017.
This methodology of calculating the “real” matric pass rate has been used widely in recent years. But a critique last month by Stellenbosch University education economist, Martin Gustafsson, highlighted its flaws.
Firstly, South African schools have very high repetition rates. A 2015 report by the department of basic education found that 23% of pupils in Grade 10 were repeating the grade. Using this grade as a base year for the calculation produces a lower “real” matric pass rate because of the repeaters.
Secondly, a higher proportion of young people eventually manage to obtain a matric than the “real matric pass rate” suggests. Based on Stats SA data, Gustafsson estimates that over 50% of young people manage to get a matric qualification - with a significant proportion doing so after the age of 18. - Kate Wilkinson
READ: The flaw in SA’s ‘real’ matric pass rate figure (as calculated by the EFF & DA)
Stats SA provided a breakdown of poverty for children by race in 2015. It shows that a far higher proportion of black children under the age of 18 lived under South Africa’s upper-bound poverty line, compared to white children.
| Child poverty (0-17 years) in South Africa in 2015 | |
| Population group | % living in poverty |
| Black/African | 73.6% |
| Coloured | 47.8% |
| Indian | 6.5% |
| White | 1.4% |
Source: Statistics South Africa
Still, Cassim’s claim is incorrect. Director of demography at the University of Cape Town, Tom Moultrie, calculated the “odds ratio” between the two groups referred to in the claim.
His calculations showed that a black child was 196 times more likely to live in poverty compared to a white child in South Africa in 2015.
FACTSHEET: South Africa’s official poverty numbers
This claim by DA member of parliament Yusuf Cassim during the debate on the State of the Nation address isn’t supported by available data.
A 2014 study by the Council on Higher Education found that 37% of students who started a three-year higher education degree in 2006 had dropped out by 2008.
Another study, by Stellenbosch University, tracked students who started their first year of university in 2009.
One year later, 9.2% of students had dropped out. This increased to 14.5% of students by the end of the second year (2010). By the end of the study (2013), a total of 28.4% of the students had dropped out.
This study was unique, according to lead researcher Dr Hendrik van Broekhuizen, as it followed students through the system - even if they changed programmes or institutions.
“If someone switches from degree to diploma, it’s not fair to call them a dropout,” Van Broekhuizen told Africa Check before.
“Previously, people haven’t had access to student record data, so if students changed course, or institution, they were lost. In our study, this was not a problem. We know how many students switched and we can still account for those. We don’t count them as dropouts.”
FACTSHEET: How many South African students graduate?
As cybercrime is rife in South Africa, the country’s law-enforcement agencies must prioritise training and capacity-building, ANC MP Francois Beukman said.
“According to the Norton cyber security insights report, over 8.8 million South Africans were the target of online cybercrime in 2016,” he claimed.
Africa Check was unable to find the full report Beukman referred to, but Norton provided a presentation of its results. Their survey involved 18,126 participants from 18 countries. In South Africa, 1,001 people older than 18 and who had at least one cellphone were surveyed online in February 2016.
A slide about online crime indicates that respondents had to answer whether they had experienced situations like the following in the past year:
1) Having had a mobile device stolen;
2) Unauthorised access to their social network profile;
3) Credit card fraud;
4) Responded to a fraudulent email and provided sensitive information;
5) Account password compromised.
David Ribeiro, Norton’s Middle East and Africa regional territory manager, told Africa Check that 67% of the respondents in South Africa reported experiencing one of these crimes between February 2015 and February 2016.
Norton extrapolated this finding to South Africa’s wider adult online population of 13,260,828, a March 2016 figure from the World Factbook, which is produced by the US Central Intelligence Agency (CIA). The CIA didn’t indicate a source, however.
Arthur Goldstuck, the managing director of technology research company World Wide Worx, said this figure for the online popuation is outdated and that most surveys on internet use in the country are not representative of the online population.
“Most surveys of South African internet users are based on online surveys, drawn from existing panels or limited online environments. This means the samples tend to be monolithic, and there is little diversity in the response base,” he said.
“In South Africa, most online panels represent highly active internet users. Even then, the most you can reliably claim from the research is that X percent of highly active Internet users have done or experienced Y. Extrapolating it to a number without qualification is a classic example of misunderstanding statistics.” - Ina Skosana
 The Economic Freedom Fighters’ Floyd Shivambu argued that the ANC cannot be described as a developmental state, as it isn’t “independent of capitalist influences”.
“We’re inheriting a crisis-ridden state, which is in debt of more than R2.3 trillion,” he added.
Government debt is typically expressed as a debt-to-GDP ratio. This provides a better indication of the scale of the debt than a sum of currency alone.
Shivambu’s figure regarding government debt is supported by the latest International Monetary Fund (IMF) data. It indicates that South Africa’s gross government debt-to-GDP ratio was 55.56% in 2017. The same dataset noted South Africa’s GDP as US$361.16 billion, and thus South Africa’s total debt comes to US$200.66 billion, or R2.357 trillion.
'Debt still manageable for SA'
But the overall state of a country’s economy cannot be assessed on this indicator alone, Jussi Lindgren, a former economic analyst at the European Commission, told Africa Check.
One also has to look at the current account balance (the sum of a country’s trade with the rest of the world), what currency the debt was in, as well as at the country’s net international investment position. (Note: At the end of September 2017, South Africa’s net international investment position had increased to R1,060 billion, the South African Reserve Bank’s latest report indicates.)
"If the national debt is only 55% and the net international investment position is positive, then the situation is not too bad," Lindgren noted. He added that at nearer 100% this would be a much more worrying sign. (Note: For comparison, the euro area’s debt-to-GDP ratio sits at around 90%.)
Henrik Paldynski, a portfolio manager at Finnish company Aktia Asset Management, told Africa Check that assessing the debt-to-GDP ratio also depends on the level of economic development in emerging markets.
“Although debt-to-GDP and government revenues are still manageable for South Africa, the budget deficit and revenue shortfall must be contained in the near future, before debt-to-GDP approaches 60%,” he said. - Markus Korhonen
EFF member Floyd Shivambu bemoaned a country “with exposure of state-owned companies that have got guarantees of government”.
“The debt that is guaranteed by the state in Eskom is R350 billion. In SANRAL, it’s R38.9 billion. In South African Airways, it’s R19.1 billion. In Denel, it’s R1.8 billion. In the Road Accident Fund, it’s R8.5 billion,” he listed. “And these are the futures that you’re inheriting.”
What is a government guarantee?
Government guarantees typically refer to loans that the government makes available should the entity, in this case the state-owned companies, not pay back their debt to creditors, such as banks. This guarantees that the recipient will be able to make payments to its debtors up to the amount provided for in the government guarantee.
South Africa’s Medium Term Budget Policy Statement in October 2017 corroborates the government guarantee figures Shivambu gave for Eskom, SANRAL, Denel and the Road Accident Fund.
National Treasury’s 2016/17 Annual Report confirms the government guarantees made to SAA (R19.1 billion) up to 31 March 2017. However, a further R10 billion will be provided to SAA in the financial year that ends next month, of which R5.2 billion has already been given.
This would bring the total guarantee issued to the airline to R29.1 billion, as we reported last year.
Total guarantees at R688.8 billion
Shivambu could perhaps also have mentioned the Trans-Caledon Tunnel Authority (TCTA). The authority is also listed by treasury as the recipient of one of the largest government guarantees issued – R25.7 billion.
The total guarantees issued by the South African government amounts to R688.8 billion. (Note: To put it into perspective, it is more than the total government expenditure allocated for health and education, which amounted to R506.6 billion in the 2017/18 financial year).
However, as not all of this had been taken up at the time the Medium Term Budget Policy Statement was published, total government exposure stood at R445 billion in October 2017. – Markus Korhonen
Additional reading:
https://africacheck.org/reports/state-of-the-nation-address-1-president-cyril-ramaphosas-claims-weighed-up/


Add new comment