Introduction
Since the beginning of 21st century and until 2019, global Greenhous gas (GHG) emissions had followed an increasing trend mainly due to the increase in emissions from China and the other emerging economies. As a result, the atmospheric concentrations of greenhouse gases substantially increased enhancing the natural greenhouse effect, which may negatively affect the life on the Earth.
Because of the COVID-19 pandemic, global emissions decreased by 3.7% in 2020 compared to 2019 levels, interrupting a more than ten-year continuously increasing trend. Nevertheless, global GHG emissions restarted to grow just after the peak of the pandemic, reaching in 2022 the level of 53.8 Gt CO2eq , which is 2.3% higher than 2019 and 1.4% higher than 2021.
In the framework of UNFCCC, countries are developing national emissions inventories and propose/implement actions to mitigate GHG emissions. CO2 emissions, which are the main contributors to global GHG emissions are still increasing at world level despite climate change mitigation agreements. In this context, EDGAR provides an independent estimate of greenhouse gases for each world country, based on a robust and consistent methodology stemming from the latest IPCC guidelines and most recent activity data. Following the latest update released in September 2023, GHG emission data are now available for all IPCC sectors for each country for the time period 1970-2022.
Main findings
China, the United States, India, the EU27, Russia and Brazil were the six world largest GHG emitters in 2022. Together they account for 50.1% of global population, 61.2% of global Gross Domestic Product (GDP), 63.4% of global fossil fuel consumption and 61.6% of global GHG emissions. Among these top emitters, in 2022 China, the United States and India increased their emissions compared to 2021, with India having the largest increase in relative terms (5%). On the contrary, the other three top emitters decreased their emissions in 2022, with Russia showing the largest decrease (-2.4%).
Global GHG emissions per capita have slightly increased in 2022 (0.4%) bringing to 8.3% its overall increase between 1990 and 2022 (from 6.24 t CO2eq/cap to 6.76 t CO2eq/cap). Global emissions intensity per GDP PPP in 2022 reached its 52-year minimum value of 0.386 tCO2eq/k USD, 2% lower than in 2021.
Even in 2022, global GHG emissions primarily consisted of CO2, resulting from the combustion of fossil fuels (71.6%). CH4 contributed 21% to the total, while the remaining share of emissions comprised N2O (4.8%) and F-gases (2.6%).
As far EU27 is concerned, its GHG emissions amounted in 2022 to 3.59 Gt CO2eq, 0.8% lower than in 2021. It is noteworthy that despite their 2021 rebound, EU27's emissions remained below the pre-COVID-19 levels, continuing their decades-long decreasing trend. Indeed, EU27 GHG emissions were 27.0% lower than in 1990, and represented 6.7% of global emissions also showing a sharp decrease from 14.8% in 1990.
In 2022, several EU27 countries experienced a decrease in their emission levels compared to the previous year, with the largest relative drops observed in Luxembourg (-11.1%), Belgium (-6.4%), Lithuania (-6.3%), Estonia (-6.3%), and the Netherlands (-6.1%). On the other hand, the largest increase in 2022 was observed in Bulgaria (+8.0%), followed by Spain (+7.4%), Portugal (+3.7%), Greece (+3.4%), Ireland (+2.2%), and Malta (+2.0%). In terms of contribution to the EU27's GHG emissions in 2022, Germany remained the largest emitter (21.9%), followed by France (12.0%), Poland (11.2%), Italy (11.0%), and Spain (9.2%).
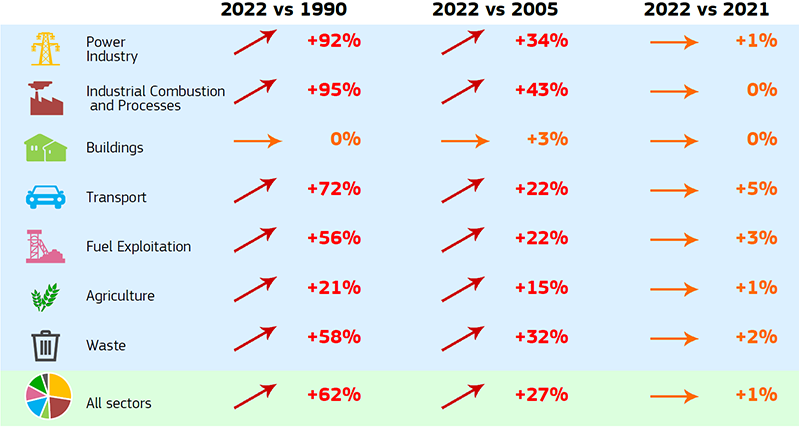
In the EU27, except for the transport and power industries, all other sectors experienced a decrease in their GHG emissions in 2022. The largest relative drop was observed in the buildings sector, in which emissions decreased by 6.5%. The industrial combustion and processes showed the second-highest decrease, falling by 4.3% below the 2021 levels. Emissions in the transport sector increased by 4.0%, while in the power sector the increase was 1.9%.
Data Download
Emissions by country
The data are presented in the table below for key years, to allow easy comparison of different countries. Data for individual GHGs (fossil CO2, CH4, N2O and F-gases) are available in the excel file in the download section (data sheet 'GHG_by_sector_and_country').
"Country names" are consistent with the Interinstitutional Style Guide of the European Commission, the "Short name" definition listed in the "List of countries, territories and currencies" table has been used (as of 01/09/2023)
EDGAR data are expressed in metric units.
| Country | 1990 | 2000 | 2005 | 2015 | 2020 | 2021 | 2022 | 2022 % |
|---|---|---|---|---|---|---|---|---|
| unit | Mton CO2eq | Mton CO2eq | Mton CO2eq | Mton CO2eq | Mton CO2eq | Mton CO2eq | Mton CO2eq | % World Tot |
| EU27 | 4915.14 | 4513.34 | 4597.10 | 3922.02 | 3427.44 | 3617.74 | 3587.80 | 6.67 |
| GLOBAL TOTAL | 33268.12 | 36991.71 | 42318.43 | 50134.38 | 50632.31 | 53056.61 | 53786.04 | 100.00 |
| Afghanistan | 13.78 | 16.05 | 18.19 | 31.21 | 28.15 | 28.95 | 29.12 | 0.05 |
| Albania | 11.57 | 7.25 | 8.07 | 8.85 | 7.86 | 7.90 | 7.98 | 0.01 |
| Algeria | 145.89 | 179.75 | 188.34 | 259.85 | 265.21 | 284.17 | 284.45 | 0.53 |
| Angola | 34.96 | 71.46 | 73.53 | 90.11 | 71.68 | 69.61 | 66.48 | 0.12 |
| Anguilla | 0.01 | 0.02 | 0.02 | 0.03 | 0.03 | 0.03 | 0.03 | 0.00 |
| Antigua and Barbuda | 0.25 | 0.23 | 0.27 | 0.36 | 0.36 | 0.35 | 0.36 | 0.00 |
| Argentina | 262.67 | 303.68 | 344.83 | 375.12 | 359.03 | 378.42 | 382.99 | 0.71 |
| Armenia | 24.37 | 6.03 | 7.43 | 8.62 | 9.80 | 10.00 | 9.38 | 0.02 |
| Aruba | 0.21 | 0.34 | 0.46 | 0.48 | 0.49 | 0.48 | 0.50 | 0.00 |
| Australia | 457.22 | 542.60 | 576.59 | 593.56 | 572.83 | 561.65 | 571.38 | 1.06 |
| Austria | 81.51 | 84.76 | 96.88 | 82.72 | 78.31 | 81.22 | 76.74 | 0.14 |
| Azerbaijan | 69.81 | 41.44 | 46.46 | 58.03 | 63.53 | 68.04 | 68.88 | 0.13 |
| Bahamas | 1.29 | 1.23 | 1.15 | 1.46 | 1.87 | 1.82 | 1.88 | 0.00 |
| Bahrain | 30.22 | 39.60 | 43.73 | 62.94 | 67.63 | 69.43 | 69.98 | 0.13 |
| Bangladesh | 139.91 | 156.85 | 179.56 | 248.09 | 269.03 | 276.80 | 281.08 | 0.52 |
| Barbados | 0.86 | 0.86 | 0.89 | 0.94 | 0.92 | 0.90 | 0.93 | 0.00 |
| Belarus | 137.53 | 78.02 | 81.38 | 100.53 | 100.06 | 102.49 | 99.87 | 0.19 |
| Belgium | 142.80 | 153.80 | 145.84 | 128.00 | 116.79 | 121.88 | 114.03 | 0.21 |
| Belize | 0.50 | 0.53 | 0.60 | 0.86 | 0.91 | 0.95 | 0.98 | 0.00 |
| Benin | 4.20 | 6.55 | 8.76 | 14.50 | 19.06 | 20.10 | 20.69 | 0.04 |
| Bermuda | 0.27 | 0.17 | 0.21 | 0.25 | 0.35 | 0.34 | 0.35 | 0.00 |
| Bhutan | 1.16 | 1.62 | 1.85 | 2.67 | 3.41 | 3.06 | 3.07 | 0.01 |
| Bolivia | 31.28 | 31.21 | 36.47 | 54.59 | 53.95 | 58.29 | 58.46 | 0.11 |
| Bosnia and Herzegovina | 32.79 | 19.92 | 23.25 | 27.96 | 30.23 | 29.29 | 29.32 | 0.05 |
| Botswana | 9.33 | 10.76 | 10.14 | 12.79 | 10.59 | 11.34 | 12.61 | 0.02 |
| Brazil | 695.64 | 934.71 | 1067.46 | 1307.97 | 1277.69 | 1343.14 | 1310.50 | 2.44 |
| British Virgin Islands | 0.02 | 0.03 | 0.04 | 0.08 | 0.08 | 0.07 | 0.08 | 0.00 |
| Brunei | 8.18 | 11.27 | 11.47 | 12.69 | 15.48 | 15.34 | 14.83 | 0.03 |
| Bulgaria | 104.99 | 63.14 | 66.76 | 64.91 | 56.08 | 63.36 | 68.41 | 0.13 |
| Burkina Faso | 11.28 | 14.87 | 20.70 | 29.42 | 34.40 | 35.58 | 36.50 | 0.07 |
| Burundi | 3.06 | 3.33 | 3.73 | 6.14 | 7.14 | 7.33 | 7.48 | 0.01 |
| Cabo Verde | 0.23 | 0.54 | 0.86 | 1.07 | 1.18 | 1.25 | 1.30 | 0.00 |
| Cambodia | 20.26 | 24.14 | 28.92 | 37.39 | 48.60 | 49.69 | 50.02 | 0.09 |
| Cameroon | 31.27 | 32.70 | 32.47 | 41.04 | 43.53 | 43.67 | 43.17 | 0.08 |
| Canada | 582.17 | 710.25 | 745.21 | 764.53 | 711.47 | 733.08 | 756.81 | 1.41 |
| Cayman Islands | 0.12 | 0.14 | 0.16 | 0.27 | 0.34 | 0.33 | 0.34 | 0.00 |
| Central African Republic | 7.82 | 9.57 | 10.29 | 12.07 | 12.86 | 13.13 | 13.45 | 0.03 |
| Chad | 11.14 | 26.66 | 36.55 | 63.00 | 82.09 | 86.02 | 89.84 | 0.17 |
| Chile | 60.74 | 88.19 | 95.55 | 121.12 | 128.96 | 140.66 | 137.01 | 0.25 |
| China | 4073.56 | 5425.51 | 8431.92 | 13479.88 | 14879.56 | 15632.89 | 15684.63 | 29.16 |
| Colombia | 139.10 | 159.19 | 164.78 | 193.01 | 206.09 | 209.85 | 215.54 | 0.40 |
| Comoros | 0.34 | 0.45 | 0.54 | 0.68 | 0.87 | 0.91 | 0.92 | 0.00 |
| Congo | 11.47 | 22.60 | 20.72 | 21.24 | 26.66 | 25.11 | 25.96 | 0.05 |
| Cook Islands | 0.05 | 0.08 | 0.10 | 0.12 | 0.11 | 0.12 | 0.12 | 0.00 |
| Costa Rica | 10.00 | 11.48 | 12.44 | 14.99 | 15.06 | 16.21 | 16.86 | 0.03 |
| Côte d’Ivoire | 11.28 | 18.66 | 20.28 | 29.24 | 33.63 | 35.30 | 36.18 | 0.07 |
| Croatia | 34.07 | 25.86 | 30.01 | 25.76 | 24.33 | 24.16 | 24.18 | 0.04 |
| Cuba | 63.55 | 50.75 | 46.03 | 50.77 | 44.41 | 43.90 | 44.38 | 0.08 |
| Curaçao | 2.86 | 5.90 | 6.15 | 5.95 | 2.16 | 2.08 | 2.15 | 0.00 |
| Cyprus | 5.55 | 8.31 | 9.18 | 8.59 | 9.54 | 10.38 | 10.63 | 0.02 |
| Czechia | 197.20 | 154.20 | 151.15 | 131.37 | 116.97 | 123.19 | 124.50 | 0.23 |
| Democratic Republic of the Congo | 28.58 | 31.09 | 30.97 | 52.66 | 58.96 | 60.59 | 61.64 | 0.11 |
| Denmark | 69.46 | 70.57 | 67.26 | 50.05 | 44.05 | 47.09 | 45.80 | 0.09 |
| Djibouti | 1.89 | 1.91 | 1.97 | 2.14 | 2.11 | 2.20 | 2.23 | 0.00 |
| Dominica | 0.09 | 0.12 | 0.13 | 0.15 | 0.15 | 0.14 | 0.15 | 0.00 |
| Dominican Republic | 18.07 | 29.29 | 30.91 | 39.53 | 40.75 | 41.23 | 41.86 | 0.08 |
| Ecuador | 38.51 | 46.21 | 56.60 | 72.77 | 65.80 | 73.26 | 76.94 | 0.14 |
| Egypt | 153.02 | 206.84 | 278.86 | 342.43 | 336.01 | 360.40 | 377.78 | 0.70 |
| El Salvador | 7.78 | 11.11 | 13.03 | 12.65 | 11.79 | 12.66 | 13.07 | 0.02 |
| Equatorial Guinea | 0.18 | 12.42 | 17.07 | 18.67 | 12.71 | 12.86 | 11.55 | 0.02 |
| Eritrea | 4.83 | 5.68 | 5.76 | 6.40 | 6.78 | 6.89 | 6.95 | 0.01 |
| Estonia | 43.09 | 20.72 | 22.73 | 24.05 | 14.63 | 14.73 | 13.81 | 0.03 |
| Eswatini | 3.34 | 3.41 | 3.37 | 3.06 | 3.18 | 3.22 | 3.39 | 0.01 |
| Ethiopia | 66.23 | 76.68 | 95.21 | 145.65 | 179.20 | 186.28 | 192.47 | 0.36 |
| Falkland Islands | 0.01 | 0.01 | 0.01 | 0.02 | 0.02 | 0.02 | 0.03 | 0.00 |
| Faroes | 0.05 | 0.05 | 0.05 | 0.05 | 0.05 | 0.05 | 0.05 | 0.00 |
| Fiji | 2.20 | 3.03 | 3.30 | 2.65 | 2.78 | 2.90 | 2.98 | 0.01 |
| Finland | 85.56 | 86.14 | 87.45 | 71.11 | 58.14 | 57.40 | 54.81 | 0.10 |
| France and Monaco | 535.19 | 544.03 | 546.47 | 464.53 | 405.72 | 442.59 | 430.36 | 0.80 |
| French Guiana | 0.37 | 0.34 | 0.36 | 0.52 | 0.57 | 0.58 | 0.59 | 0.00 |
| French Polynesia | 0.96 | 0.94 | 1.15 | 1.19 | 1.06 | 1.10 | 1.12 | 0.00 |
| Gabon | 20.39 | 27.96 | 26.34 | 21.68 | 20.01 | 19.03 | 18.63 | 0.03 |
| Georgia | 42.12 | 11.54 | 11.26 | 16.47 | 17.31 | 17.94 | 18.05 | 0.03 |
| Germany | 1235.23 | 1032.29 | 983.71 | 908.13 | 751.34 | 792.45 | 784.00 | 1.46 |
| Ghana | 11.32 | 16.84 | 19.31 | 36.49 | 49.47 | 51.62 | 53.01 | 0.10 |
| Gibraltar | 0.16 | 0.36 | 0.43 | 0.61 | 0.67 | 0.67 | 0.69 | 0.00 |
| Greece | 99.51 | 121.69 | 128.98 | 91.37 | 71.93 | 73.55 | 76.03 | 0.14 |
| Greenland | 0.07 | 0.07 | 0.69 | 0.60 | 0.53 | 0.51 | 0.54 | 0.00 |
| Grenada | 0.10 | 0.11 | 0.13 | 0.18 | 0.19 | 0.19 | 0.19 | 0.00 |
| Guadeloupe | 0.96 | 0.90 | 0.99 | 1.24 | 1.20 | 1.23 | 1.26 | 0.00 |
| Guatemala | 14.15 | 23.21 | 27.40 | 38.08 | 41.61 | 44.52 | 45.02 | 0.08 |
| Guinea | 7.90 | 11.50 | 13.78 | 23.20 | 27.24 | 28.29 | 29.28 | 0.05 |
| Guinea-Bissau | 1.66 | 2.01 | 2.18 | 2.98 | 3.14 | 3.19 | 3.24 | 0.01 |
| Guyana | 3.85 | 4.80 | 4.45 | 5.78 | 7.27 | 7.67 | 7.79 | 0.01 |
| Haiti | 7.93 | 10.48 | 11.25 | 14.52 | 14.77 | 14.71 | 14.87 | 0.03 |
| Honduras | 9.65 | 12.26 | 16.53 | 22.61 | 21.60 | 22.97 | 23.74 | 0.04 |
| Hong Kong | 39.97 | 47.32 | 48.36 | 50.44 | 41.67 | 41.08 | 39.14 | 0.07 |
| Hungary | 96.78 | 77.21 | 80.24 | 64.48 | 68.10 | 70.33 | 66.21 | 0.12 |
| Iceland | 4.43 | 3.94 | 4.27 | 4.89 | 4.27 | 4.28 | 4.77 | 0.01 |
| India | 1436.58 | 1919.34 | 2203.10 | 3389.88 | 3519.12 | 3754.63 | 3943.26 | 7.33 |
| Indonesia | 427.66 | 602.21 | 694.31 | 961.41 | 1104.71 | 1128.06 | 1240.83 | 2.31 |
| International Aviation | 261.80 | 355.89 | 423.31 | 532.88 | 299.33 | 345.38 | 425.96 | 0.79 |
| International Shipping | 394.75 | 533.72 | 607.27 | 702.30 | 671.96 | 710.46 | 750.70 | 1.40 |
| Iran | 332.76 | 525.59 | 683.56 | 857.02 | 901.56 | 936.57 | 951.98 | 1.77 |
| Iraq | 169.63 | 165.70 | 163.85 | 273.11 | 329.53 | 340.17 | 367.94 | 0.68 |
| Ireland | 57.59 | 74.65 | 75.34 | 64.02 | 59.46 | 61.10 | 62.42 | 0.12 |
| Israel and Palestine, State of | 42.69 | 70.43 | 73.94 | 86.88 | 83.58 | 84.45 | 87.75 | 0.16 |
| Italy, San Marino and the Holy See | 513.74 | 545.78 | 580.43 | 430.30 | 367.41 | 392.96 | 394.75 | 0.73 |
| Jamaica | 9.29 | 12.25 | 12.60 | 8.69 | 7.50 | 7.70 | 7.71 | 0.01 |
| Japan | 1321.81 | 1391.88 | 1402.61 | 1335.57 | 1161.78 | 1175.42 | 1182.77 | 2.20 |
| Jordan | 12.54 | 20.46 | 25.59 | 33.92 | 31.50 | 33.54 | 34.54 | 0.06 |
| Kazakhstan | 349.54 | 178.77 | 243.17 | 276.04 | 308.44 | 319.12 | 331.53 | 0.62 |
| Kenya | 42.67 | 47.46 | 59.86 | 92.11 | 109.71 | 114.27 | 117.89 | 0.22 |
| Kiribati | 0.04 | 0.06 | 0.09 | 0.10 | 0.10 | 0.11 | 0.11 | 0.00 |
| Kuwait | 49.87 | 86.18 | 117.47 | 140.98 | 148.89 | 156.06 | 167.86 | 0.31 |
| Kyrgyzstan | 33.70 | 11.29 | 12.05 | 19.95 | 20.33 | 21.47 | 21.94 | 0.04 |
| Laos | 8.24 | 10.34 | 11.74 | 23.21 | 35.49 | 36.62 | 36.86 | 0.07 |
| Latvia | 27.27 | 10.23 | 11.74 | 11.95 | 11.64 | 11.63 | 11.11 | 0.02 |
| Lebanon | 8.06 | 18.65 | 20.98 | 33.36 | 29.17 | 30.63 | 31.93 | 0.06 |
| Lesotho | 2.21 | 2.74 | 2.83 | 2.85 | 2.96 | 2.96 | 3.02 | 0.01 |
| Liberia | 1.79 | 2.14 | 2.70 | 4.33 | 4.98 | 5.21 | 5.31 | 0.01 |
| Libya | 86.63 | 91.34 | 105.18 | 76.09 | 69.48 | 101.47 | 104.51 | 0.19 |
| Lithuania | 46.63 | 18.45 | 21.68 | 23.27 | 22.71 | 22.24 | 20.85 | 0.04 |
| Luxembourg | 12.67 | 9.81 | 13.07 | 10.24 | 8.98 | 9.53 | 8.48 | 0.02 |
| Macao | 1.01 | 1.74 | 2.30 | 2.99 | 2.30 | 2.38 | 2.41 | 0.00 |
| Madagascar | 25.25 | 27.67 | 28.17 | 33.64 | 35.03 | 35.14 | 34.98 | 0.07 |
| Malawi | 6.40 | 8.67 | 9.74 | 14.93 | 18.94 | 19.74 | 20.92 | 0.04 |
| Malaysia | 94.79 | 185.31 | 246.08 | 321.31 | 324.52 | 334.67 | 353.92 | 0.66 |
| Maldives | 0.15 | 0.80 | 0.85 | 1.82 | 2.28 | 2.37 | 2.42 | 0.00 |
| Mali | 13.39 | 17.60 | 22.42 | 35.31 | 45.59 | 47.45 | 49.38 | 0.09 |
| Malta | 2.49 | 2.36 | 2.92 | 2.12 | 2.09 | 2.14 | 2.18 | 0.00 |
| Martinique | 0.92 | 0.84 | 0.88 | 1.08 | 0.91 | 1.05 | 1.08 | 0.00 |
| Mauritania | 6.65 | 9.09 | 10.40 | 13.54 | 15.77 | 16.33 | 16.67 | 0.03 |
| Mauritius | 1.98 | 3.40 | 3.84 | 5.70 | 5.73 | 6.09 | 6.41 | 0.01 |
| Mexico | 466.42 | 634.17 | 707.98 | 790.36 | 739.32 | 765.46 | 819.87 | 1.52 |
| Moldova | 37.45 | 9.83 | 11.18 | 11.54 | 12.34 | 12.96 | 12.32 | 0.02 |
| Mongolia | 25.92 | 25.38 | 25.06 | 48.38 | 64.73 | 62.16 | 62.79 | 0.12 |
| Morocco | 45.25 | 60.15 | 74.24 | 97.88 | 108.01 | 117.30 | 114.77 | 0.21 |
| Mozambique | 10.38 | 12.98 | 17.95 | 30.18 | 34.71 | 37.72 | 40.07 | 0.07 |
| Myanmar/Burma | 72.77 | 91.33 | 111.06 | 134.83 | 163.51 | 166.96 | 169.39 | 0.31 |
| Namibia | 6.64 | 8.50 | 10.70 | 12.00 | 12.41 | 12.63 | 13.10 | 0.02 |
| Nepal | 31.60 | 36.06 | 37.51 | 45.73 | 55.48 | 56.56 | 56.74 | 0.11 |
| Netherlands | 228.34 | 229.77 | 226.13 | 208.38 | 176.88 | 178.70 | 167.85 | 0.31 |
| New Caledonia | 1.91 | 2.66 | 3.14 | 5.14 | 5.47 | 5.65 | 5.69 | 0.01 |
| New Zealand | 70.54 | 81.82 | 88.08 | 86.68 | 85.21 | 85.14 | 82.72 | 0.15 |
| Nicaragua | 10.61 | 13.66 | 14.98 | 19.76 | 19.84 | 20.59 | 21.03 | 0.04 |
| Niger | 11.68 | 17.51 | 21.58 | 31.79 | 39.88 | 41.57 | 43.24 | 0.08 |
| Nigeria | 287.31 | 419.54 | 399.98 | 404.08 | 408.25 | 409.45 | 407.69 | 0.76 |
| North Korea | 169.84 | 103.94 | 113.56 | 55.75 | 80.42 | 82.59 | 81.29 | 0.15 |
| North Macedonia | 14.47 | 11.49 | 12.44 | 10.65 | 10.39 | 11.15 | 11.18 | 0.02 |
| Norway | 62.91 | 72.38 | 74.51 | 74.30 | 70.08 | 71.68 | 69.97 | 0.13 |
| Oman | 33.46 | 52.02 | 66.65 | 117.17 | 122.64 | 131.69 | 137.24 | 0.26 |
| Pakistan | 215.03 | 296.59 | 351.13 | 455.75 | 527.44 | 561.01 | 546.10 | 1.02 |
| Palau | 2.33 | 2.23 | 1.84 | 1.25 | 1.34 | 1.39 | 1.42 | 0.00 |
| Panama | 7.37 | 10.20 | 12.93 | 17.03 | 16.46 | 17.86 | 18.48 | 0.03 |
| Papua New Guinea | 3.85 | 6.54 | 9.57 | 11.14 | 8.89 | 9.13 | 9.10 | 0.02 |
| Paraguay | 21.38 | 25.63 | 26.63 | 41.69 | 43.49 | 45.57 | 45.57 | 0.08 |
| Peru | 47.00 | 61.57 | 66.34 | 95.61 | 89.32 | 97.73 | 105.14 | 0.20 |
| Philippines | 109.81 | 149.36 | 162.96 | 210.10 | 242.64 | 254.43 | 265.30 | 0.49 |
| Poland | 514.61 | 413.21 | 412.03 | 389.99 | 374.33 | 406.94 | 400.82 | 0.75 |
| Portugal | 59.46 | 81.93 | 84.12 | 67.78 | 58.43 | 57.58 | 59.71 | 0.11 |
| Puerto Rico | 21.71 | 27.36 | 28.59 | 14.22 | 14.96 | 15.52 | 15.26 | 0.03 |
| Qatar | 29.08 | 69.91 | 83.45 | 187.61 | 191.20 | 197.51 | 194.65 | 0.36 |
| Réunion | 1.16 | 2.43 | 2.76 | 2.93 | 3.00 | 3.06 | 3.15 | 0.01 |
| Romania | 245.77 | 133.27 | 140.12 | 117.60 | 114.44 | 119.96 | 117.06 | 0.22 |
| Russia | 3053.15 | 2134.35 | 2221.77 | 2294.78 | 2432.51 | 2606.63 | 2579.80 | 4.80 |
| Rwanda | 6.22 | 4.73 | 5.54 | 7.88 | 8.73 | 8.93 | 9.03 | 0.02 |
| Saint Helena, Ascension and Tristan da Cunha | 0.01 | 0.01 | 0.01 | 0.02 | 0.02 | 0.02 | 0.02 | 0.00 |
| Saint Kitts and Nevis | 0.07 | 0.10 | 0.11 | 0.15 | 0.15 | 0.15 | 0.15 | 0.00 |
| Saint Lucia | 0.16 | 0.23 | 0.24 | 0.32 | 0.42 | 0.42 | 0.43 | 0.00 |
| Saint Pierre and Miquelon | 0.09 | 0.02 | 0.03 | 0.04 | 0.04 | 0.04 | 0.04 | 0.00 |
| Saint Vincent and the Grenadines | 0.09 | 0.10 | 0.13 | 0.16 | 0.15 | 0.15 | 0.15 | 0.00 |
| Samoa | 0.30 | 0.40 | 0.44 | 0.59 | 0.54 | 0.55 | 0.55 | 0.00 |
| São Tomé and Príncipe | 0.09 | 0.12 | 0.16 | 0.23 | 0.26 | 0.27 | 0.26 | 0.00 |
| Saudi Arabia | 238.39 | 355.02 | 466.49 | 771.90 | 755.37 | 779.97 | 810.51 | 1.51 |
| Senegal | 10.46 | 14.32 | 16.96 | 24.54 | 28.47 | 29.70 | 30.61 | 0.06 |
| Serbia and Montenegro | 85.53 | 66.40 | 76.99 | 69.94 | 71.92 | 70.01 | 69.94 | 0.13 |
| Seychelles | 0.33 | 0.85 | 1.05 | 1.08 | 1.13 | 1.18 | 1.20 | 0.00 |
| Sierra Leone | 4.07 | 3.39 | 5.00 | 6.65 | 6.87 | 7.03 | 7.12 | 0.01 |
| Singapore | 34.20 | 57.88 | 51.21 | 67.03 | 69.41 | 71.34 | 70.47 | 0.13 |
| Slovakia | 74.71 | 51.43 | 52.15 | 44.24 | 42.43 | 46.67 | 45.56 | 0.08 |
| Slovenia | 21.43 | 20.50 | 23.67 | 19.01 | 18.12 | 18.68 | 18.28 | 0.03 |
| Solomon Islands | 0.27 | 0.41 | 0.49 | 0.58 | 0.56 | 0.58 | 0.59 | 0.00 |
| Somalia | 25.35 | 27.48 | 30.34 | 30.58 | 32.57 | 33.05 | 33.36 | 0.06 |
| South Africa | 411.94 | 457.24 | 555.48 | 590.09 | 551.46 | 548.48 | 534.53 | 0.99 |
| South Korea | 330.37 | 545.18 | 582.52 | 719.38 | 699.65 | 730.84 | 725.74 | 1.35 |
| Spain and Andorra | 300.27 | 398.46 | 455.62 | 351.38 | 291.81 | 305.89 | 328.59 | 0.61 |
| Sri Lanka | 23.10 | 28.33 | 32.33 | 41.24 | 42.39 | 41.72 | 38.80 | 0.07 |
| Sudan and South Sudan | 62.64 | 97.23 | 116.45 | 133.20 | 142.06 | 145.13 | 146.96 | 0.27 |
| Suriname | 1.92 | 2.56 | 2.65 | 3.92 | 3.80 | 4.49 | 4.50 | 0.01 |
| Sweden | 79.21 | 80.80 | 81.44 | 66.67 | 62.78 | 61.41 | 60.64 | 0.11 |
| Switzerland and Liechtenstein | 54.84 | 53.88 | 56.34 | 49.60 | 45.20 | 45.98 | 45.56 | 0.08 |
| Syria | 64.10 | 87.17 | 89.64 | 44.71 | 44.14 | 45.05 | 46.31 | 0.09 |
| Taiwan | 140.58 | 248.98 | 332.14 | 310.30 | 305.50 | 320.52 | 307.68 | 0.57 |
| Tajikistan | 22.33 | 10.78 | 12.08 | 15.59 | 21.19 | 22.43 | 22.83 | 0.04 |
| Tanzania | 31.17 | 42.56 | 50.95 | 75.45 | 85.15 | 88.12 | 89.38 | 0.17 |
| Thailand | 221.90 | 305.63 | 381.18 | 447.45 | 449.40 | 455.67 | 463.87 | 0.86 |
| The Gambia | 0.97 | 1.27 | 1.53 | 2.20 | 2.24 | 2.30 | 2.34 | 0.00 |
| Timor-Leste | 0.60 | 1.02 | 2.04 | 3.67 | 2.58 | 2.57 | 2.48 | 0.00 |
| Togo | 3.57 | 5.24 | 6.06 | 8.30 | 10.38 | 10.81 | 11.09 | 0.02 |
| Tonga | 0.19 | 0.22 | 0.24 | 0.25 | 0.27 | 0.28 | 0.28 | 0.00 |
| Trinidad and Tobago | 18.19 | 28.47 | 51.84 | 55.97 | 47.26 | 45.33 | 45.91 | 0.09 |
| Tunisia | 23.92 | 33.17 | 36.50 | 44.36 | 42.09 | 48.99 | 49.82 | 0.09 |
| Turkmenistan | 86.64 | 73.97 | 100.27 | 126.75 | 123.48 | 128.00 | 128.92 | 0.24 |
| Turks and Caicos Islands | 0.01 | 0.03 | 0.04 | 0.09 | 0.10 | 0.10 | 0.10 | 0.00 |
| Türkiye | 228.09 | 323.04 | 336.52 | 521.91 | 614.49 | 666.80 | 687.53 | 1.28 |
| Uganda | 18.45 | 23.80 | 28.50 | 48.27 | 53.92 | 55.54 | 56.49 | 0.11 |
| Ukraine | 952.14 | 448.05 | 444.00 | 301.12 | 274.46 | 260.08 | 208.61 | 0.39 |
| United Arab Emirates | 84.79 | 127.72 | 169.63 | 272.73 | 271.28 | 286.76 | 295.11 | 0.55 |
| United Kingdom | 786.21 | 700.69 | 681.82 | 505.06 | 407.94 | 425.71 | 426.56 | 0.79 |
| United States | 6163.74 | 7188.18 | 7101.88 | 6288.54 | 5615.57 | 5923.30 | 6017.44 | 11.19 |
| Uruguay | 29.65 | 34.63 | 38.13 | 41.68 | 40.84 | 41.90 | 41.91 | 0.08 |
| Uzbekistan | 177.17 | 181.94 | 191.58 | 187.89 | 211.86 | 221.60 | 227.21 | 0.42 |
| Vanuatu | 0.48 | 0.55 | 0.56 | 0.67 | 0.61 | 0.60 | 0.59 | 0.00 |
| Venezuela | 166.75 | 226.31 | 247.49 | 264.02 | 148.68 | 159.98 | 169.52 | 0.32 |
| Vietnam | 112.02 | 174.90 | 239.90 | 358.06 | 499.45 | 496.73 | 489.16 | 0.91 |
| Western Sahara | 0.24 | 0.40 | 0.46 | 0.47 | 0.44 | 0.49 | 0.49 | 0.00 |
| Yemen | 18.24 | 33.24 | 45.38 | 35.07 | 35.65 | 36.99 | 38.01 | 0.07 |
| Zambia | 16.29 | 15.96 | 17.32 | 24.99 | 28.95 | 29.68 | 30.33 | 0.06 |
| Zimbabwe | 35.26 | 33.73 | 28.59 | 31.61 | 28.34 | 29.53 | 30.19 | 0.06 |
Sources and references
Artés, T., Oom, D., De Rigo, D., Durrant, T.H., Maianti, P., Libertà, G. and San-Miguel-Ayanz, J. A global wildfire dataset for the analysis of fire regimes and fire behaviour. Scientific data, 6(1), 1-11 (2019). doi:10.1038/s41597-019-0312-2.
EI, Energy Institute, 2023 Statistical Review of World Energy, 2023, https://www.energyinst.org/statistical-review, Last access: July 2023.
FAOSTAT, Statistics Division of the Food and Agricultural Organisation of the UN: www.fao.org/faostat, Last access April 2023.
Grassi, G., Conchedda, G., Federici, S., Abad Viñas, R., Korosuo, A., Melo, J., Rossi, S., Sandker, M., Somogyi, Z., and Tubiello, F. N.: Carbon fluxes from land 2000–2020: bringing clarity on countries’ reporting, Earth Syst. Sci. Data, 14, 4643–4666, 2022, doi:10.5194/essd-14-4643-2022.
IEA World Energy Balances 2022 Edition, www.iea.org.
IEA Greenhouse Gas Emissions from Energy - 2022 Edition, www.iea.org.
IFA, Urea consumption (updates 2010-2019) and production (updates 2020) statistics, 2022, www.ifastat.org/, Last access: June 2023.
IATA, International Air Transport Association Statistics, www.iata.org/en/iata-repository/pressroom/fact-sheets/industry-statistics, 2023, Last access: July 2023.
Olivier, J.G.J, Trends in global CO2 and total greenhouse gas emissions: 2021 Summary Report, PBL Netherlands Environmental Assessment Agency, The Hague, 2022.
USGS, USGS Commodity Statistics (June 2022), (www.usgs.gov/centers/nmic/commodity-statistics-and-information), 2023, Last access: May 2023.
WB, data of GDP PPP, (constant 2017 international $) (expressed in 1000 US dollar, and adjusted to the Purchasing Power Parity of 2017) for 1990-2022, World Bank, 2023, July 2023.
World Steel Association, (worldsteel) , Steel Statistical Yearbook 2021, https://worldsteel.org/steel-topics/statistics/annual-production-steel-data/?ind=P1_crude_steel_total_pub/CHN, 2023, Last access: May 2023.
Conditions of use
©European Union 2023, European Commission, Joint Research Centre (JRC), EDGAR (Emissions Database for Global Atmospheric Research) Community GHG database, comprising IEA-EDGAR CO2, EDGAR CH4, EDGAR N2O and EDGAR F-gases version 8.0 (2023). Unless otherwise noted, all material owned by the European Union is licensed under the Creative Commons Attribution 4.0 International (CC BY 4.0) licence. This means that reuse is allowed, provided that appropriate credit is given and any changes are indicated.
All emissions, except for CO2 emissions from fuel combustion, are from the EDGAR (Emissions Database for Global Atmospheric Research) Community GHG database comprising IEA-EDGAR CO2, EDGAR CH4, EDGAR N2O and EDGAR F-gases version 8.0 (2023).
IEA-EDGAR CO2, a component of the EDGAR (Emissions Database for Global Atmospheric Research) Community GHG database version 8.0 (2023) including or based on data from IEA (2022) Greenhouse Gas Emissions from Energy, www.iea.org/data-and-statistics, as modified by the Joint Research Centre.
IEA-EDGAR CO2 data are based on data from IEA (2022) Greenhouse Gas Emissions from Energy, www.iea.org/data-and-statistics, as modified by the Joint Research Centre, licensed under CC BY-NC-ND 4.0. Users of the IEA-EDGAR CO2 data should contact the IEA at compliance@iea.org if they wish to use such data outside the terms of the CC-BY-NC-ND 4.0 licence.
Co-authorship and involvement of the EDGAR Community, which includes the IEA for fossil CO2 emissions, in the emission data analysis is highly appreciated. User's comments and requests can be sent via email to the authors. For IEA data, please refer to emissions@iea.org.
Disclaimer: Without prejudice to the rules applying to the information and data made available by the European Union (in particular the European Commission), as available here and to the maximum extent permitted by applicable law, the European Union ("the Union") and the International Energy Agency ("IEA") disclaim all responsibility or liability in relation to any and all information distributed, published or otherwise made available by them on the EDGAR website, in this dataset and/or in this publication. The Union and the IEA provide any such information as-is and as-available, and make no representations, conditions or warranties of any kind concerning this information, whether express, implied, statutory, or other (including, without limitation, any warranties or conditions of title, non-infringement, merchantability, or fitness for a particular purpose). To the maximum extent permitted by applicable law, in no event shall the Union or the IEA be liable to any third party on any legal theory (including, without limitation, negligence) or otherwise for any direct, special, indirect, incidental, consequential, punitive, exemplary, or other losses, costs, expenses, or damages arising out of the distribution, publication, making available or use of any such information.
How to cite the content of reports
Crippa, M., Guizzardi, D., Pagani, F., Banja, M., Muntean, M., Schaaf E., Becker, W., Monforti-Ferrario, F., Quadrelli, R., Risquez Martin, A., Taghavi-Moharamli, P., Köykkä, J., Grassi, G., Rossi, S., Brandao De Melo, J., Oom, D., Branco, A., San-Miguel, J., Vignati, E., GHG emissions of all world countries, Publications Office of the European Union, Luxembourg, 2023, doi:10.2760/953322, JRC134504.
How to cite the use of underlying data
EDGAR (Emissions Database for Global Atmospheric Research) Community GHG Database, a collaboration between the European Commission, Joint Research Centre (JRC), the International Energy Agency (IEA), and comprising IEA-EDGAR CO2, EDGAR CH4, EDGAR N2O, EDGAR F-GASES version 8.0, (2023) European Commission, JRC (Datasets). The complete citation of the EDGAR Community GHG Database is available in the 'Sources and References' section.
IEA-EDGAR CO2, a component of the EDGAR (Emissions Database for Global Atmospheric Research) Community GHG database version 8.0 (2023) including or based on data from IEA (2022) Greenhouse Gas Emissions from Energy, www.iea.org/data-and-statistics, as modified by the Joint Research Centre.
Users of the data are obliged to acknowledge the source of the data also with reference to the EDGARv8.0 website (link) and/or relevant reports.
Contacts
For more information or data: JRC-EDGAR@ec.europa.eu. For IEA data, please refer to emissions@iea.org or compliance@iea.org for terms questions.