Number of clinical trials by year, country, WHO region and income group (1999-2022)
Published: February 2023
The number of trials listed in the WHO International Clinical Trials Registry Platform (ICTRP) is reported by year, country, WHO region and income group for the period 1999–2022. Note that the ICTRP comprises both interventional and observational trials. See more on scope of ICTRP below.
What you see | Scope and limitations | Data sources | Previous versions
What you see
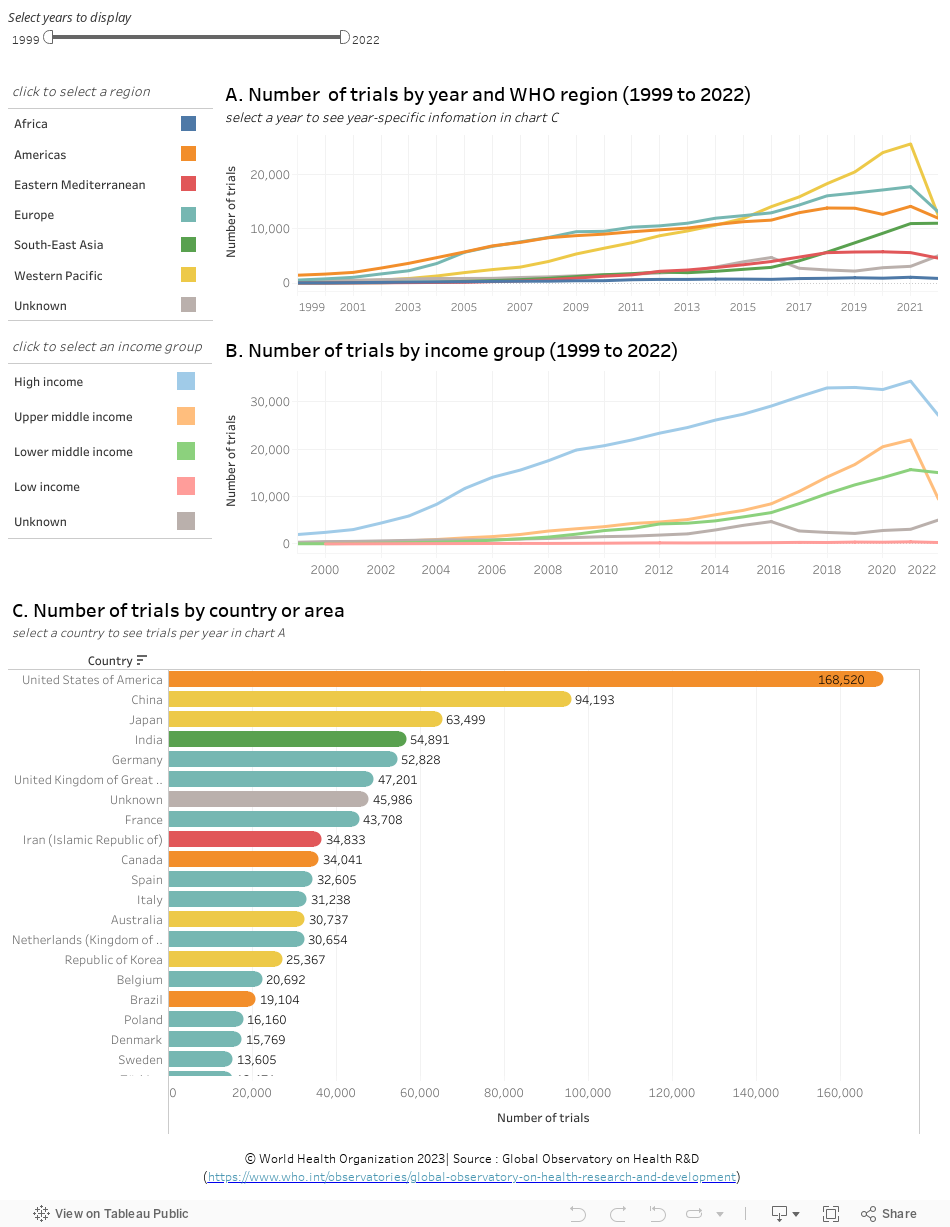
The data visualization above shows the trend in the registration of trials reported on ICTRP from 1999 to 2022, grouped by WHO region (chart A), and income group (chart B). The year corresponds to the date of enrollment of the first trial participant, in a small number of cases when this is not available, the registration year is used. (Multicountry trials conducted in the same region or income group are counted as one trial in chart A and chart B).
Chart C shows the number of recruiting trials by country, colour coded by WHO region. (Here, a multicountry trial is counted once in each participating country.)
Points to note:
- Over the analysis period, there was a steady rise in the number of newly recruiting trials registered on ICTRP for most WHO regions, although in 2022, a decrease is noticed in almost all regions, notably in Western Pacific region with 52% decrease compared with 2021. However, the number of trials registered in WHO’s Europe, Americas and Western Pacific regions has increased at a much higher rate than in other regions. For example, in 2022 the number of trials registered in Western Pacific (12,337) was around 14 times higher than that in Africa (861) (chart A).
- Since 2016, the Western Pacific region is becoming the region with the highest number of trial registration per year among WHO regions, along with the Europe and the region of the Americas (chart A). The increase comes primarily from a large number of trial registration in China and Japan, which rank as first and second in the Western Pacific region respectively (select Western Pacific in chart A and view chart C).
This may be explained by the following facts:
-- In China, an increasing number of Chinese journals, government funding agencies, universities, and hospitals require trials to be registered.
-- In 2009, trial registration was added as a requirement of ethical guidelines for medical research in Japan.
However, both countries reported a decrease between 2021 and 2022 (select China and Japan respectively in chart C, and view chart A and chart B). - Exploring the trends by income group (chart B), shows that the rise in the number of newly recruiting trials registered, reported on ICTRP, was much higher in high income group countries than in other income groups . For example, in 2022 the number of trials registered in high income countries (27,133) was over 90 times higher than in low income countries (294).
To explore the data further
- Hover the cursor on a data element of interest (for example a point on the trend line or bar beside each country) to see more information in a popup window.
- To filter results for a different range of years use the year slider (top left). To select a single year, move both sliders together to the desired year.
- To filter results by region or income group, click a region (chart A) or income group (chart B) from the key. The list of countries in chart C will be updated with the selected option.
- To explore results for a specific country, select the bar beside the desired country name in chart C. Chart A and chart B will display the trial registration trends for that country, colour coded by the corresponding region or income group respectively.
- Note that the number of trials in chart C may be higher than the trials in chart A or B as one trial is counted once per region and once per income group in chart B, but for every country participating in that trial in chart C.
- Hold the Ctrl key to select more than one option, for example two regions or countries.
- Undo a selection by clicking ‘undo’ or ‘reset’ near the bottom of the page or by clicking the same element again.
Limitations of the data and analysis
- There are several gaps in the ICTRP data source which required data cleaning to uniformly classify data elements when possible. In some cases no information was available, e.g. on the country where the trial is conducted (around 6%).
- The data presented in this visualization utilizes classifications that are not mutually exclusive. For example, a registered trial can recruit participants from multiple countries and regions. In this case, the trial will be counted once per region in chart A but once per country in chart C. The total number of trials across chart A and chart B are therefore not equivalent to that of chart C.
- The analysis will be updated at regular time points but time lags with the scheduled updates by the data sources are inevitable. Accuracy and completeness of the information is the responsibility of the data source, see terms and conditions of use.