
| NOTE: These statistics were accurate when they were released. Please consult our latest factsheet for the most recent statistics. |
Crimes that increased
The most notable aspect of the crime statistics for 2012/13 is that the violent crimes that cause the most fear and trauma amongst the public have increased. For the first time in six years there is an increase in both the number and rate of murders and attempted murders. Murder is an important indicator both because it is the most accurate of all crime categories and because it is internationally seen to be an indicator of a country's stability.
There was also a small increase in the number of sexual offences recorded by the police.
The facts about the increases in interpersonal violence are as follows:
-
Incidents of murder increased from 15 609 murders in 2011/12 to 16 259 murders in 2012/13.
-
This means that there was an increase of 650 murder cases or a 4,2% increase when comparing the total numbers of murders with the previous year.
-
This works out to almost two additional murders per day on average during the 2012/13 financial year.
-
Consequently, our murder rate increased from a total average of 43 murders per day to 45 murders per day.
-
Using the correct census data for 2011, the murder rate in 2011/12 was 30.3 per 100,000 population and not 30,9 as reported by SAPS in the last reporting period.
-
The murder rate for 2012/13 stood at 31.3 per 100,000 population which reflects an increase of 2.8% in the rate of murders (not 0.6% as presented officially).
-
South Africa’s murder rate is therefore about four and a half times higher than the global average of 6.9 murders per 100 000.
-
Attempted murder cases increased from 14 859 to 16 363, an increase of 10.1%
-
Attempted murder rates increased by 8,7% in the past year.
-
Sexual offence cases increased from 64 514 to 66 387, an increase of 2.9%.
-
Sexual offence rates increased from 125,1 per 100000 to 127,0 per 100000 population an increase of 1.5%.
The crimes above are not easy to reduce through policing alone. This is because most (around 60% to 70%) of murders, attempted murders and rapes, occur between people who know each other and occur as a result of a mix of particular social and economic factors. These crimes are often referred to by the police as ‘inter-personal’ violent crimes. Only between 15% and 20% of murders and attempted murders are the result of aggravated robbery while inter-group conflicts and vigilantism make up the rest.
There has also been an increase in robberies in 2012/13, which is a crime that the police can directly reduce through employing effective strategies. Robberies pose a particular concern as they occur when armed perpetrators directly threaten or use violence against their victims in order to steal their belongings. This can result in severe trauma, injury or sometimes death to the victim. The total number of aggravated robberies reported to the police increased from 101 203 cases to 105 888 cases (an increase of 4 685 cases) or 4.6%. The aggravated robbery rate increased by 196.2 per 100 000 people to 202.6 per 100 000 people of which represents an increase of 3.2%.
Total aggravated robbery includes a number of sub-categories, most of which increased in the 2012/13 financial year:
-
Street or public robberies increased by 2 534 cases to a total of 60 262 incidents. This is 4.4% higher than the 57,728 incidents recorded the previous year. It means that every day on average there were 166 cases of street robbery in 2012/13.
-
House robberies are reported when people are attacked by armed gangs while they are in their homes. This crimes increased by 7.1% to 17 950 incidents representing an additional 1 184 households being attacked when compared to the previous year. On average 49 households were attacked each day in 2012/13.
-
Business robberies increased by 2.7% to 16 377 incidents. This crime type has consistently increased in the past eight years so it is 345% higher than in 2004/05. There were an additional 426 armed attacks on businesses in 2012/13 as compared to the previous year.
-
Vehicle hijacking increased by 5.4% to 9 990 incidents. This means that 28 motor vehicles were hijacked every day on average in 2012/13.This is of particular concern given that most of these cases are as a result of organised crime syndicates.
-
The number of truck hijacking increased by 14,9% from 821 incidents in 2011/2012 to 943 incidents in 2012/2013. As with vehicle hijacking, this crime is generally perpetrated by organised crime syndicates. These increases suggest that organised crime is on the rise in South Africa.

Street-robbery primarily affects poorer people and typically occurs as they travel to and from work, school, shopping or while visiting people. This crime most often happens in quiet streets or overgrown areas as people make their way to or from taxi ranks or bus and train stations.Street robbery decreased at an average rate of 7,2% per annum between 2004/05 and 2008/09. An even larger annual average decrease of 10,4% was recorded in 2009/10 and 2010/11. This changed in 2011/12 when street robbery only decreased by a marginal 2%.
In the years when street robbery was decreasing, the crimes known as the ‘TRIO robberies’ (carjacking, house robbery and business robbery) increased substantially. Between 2004/05 and 2008/09 business robbery had increased by 319%, house robbery by 96% and hijacking by 20%. These crimes drive fear and insecurity as they affect victims in their homes, vehicles and places of work.
SAPS management have explained that improved visible policing reduced street robberies. The increased visibility was the result of the approximately 10 000 additional police officers that were hired each year on average between 2002/03 and 2009/10. However, the police believe that this had the negative effect of pushing robbers to targeting houses, businesses and vehicles instead. Yet when the police worked hard to improve security in the run-up to the FIFA World Cup, TRIO crimes stabilised. In 2009/10 there was a marginal decrease of 1,5%, for the first time in five years. During the 2010, these crimes decreased by a very significant 11,8%. But in 2011/12 the decrease in TRIO robberies the decrease was much smaller (1,3%) which suggested that the police were starting to struggle in containing these crimes.
The ‘property related crimes’ refer to categories where property is stolen. In these crimes there is no threat of violence between a perpetrator and the victim. In most cases, the victim will be unaware that the crime has occurred until they notice their property missing. The categories of property related crimes that increased are as follows:
-
Residential burglary increased by 6.8% (an additional 16 582 cases) to a total 262 113 incidents in 2012/13. This means that each day on average 720 households were burgled.
-
Business burglary increased by 5.1% (an additional 3 589 cases) to a total of 70 041 incidents. This means that each day on average 193 businesses were burgled.
-
Theft out of and from motor vehicle rate increased by 7% (an additional 9 183 cases) to a total of 130 475 incidents. This means that each day on average 358 vehicles are broken into and property stolen.
-
Commercial crime incidents (which include a range of crimes including fraud and corruption) increased by 4% (an additional 3 019 cases) to a total of 91 569 incidents. A single incident can involve tens of millions of Rands.

Crime intelligence is vital for the police to effectively reduce most of the robberies and burglaries. These crimes are typically caused by repeat offenders who use networks to sell their stolen goods. Using various intelligence techniques, the police should be able to identify the networks and individuals involved in these types of crimes and target them for criminal investigation. Solid detective work can then ensure that sufficient evidence is obtained to successfully prosecute those involved. Removing these individuals from society decreases the risks to others and ultimately reduces these types of crime. The SAPS have both the resources, technology and experienced officials to achieve such successes. However, the key challenge facing the SAPS during this time was political interference in its leadership at the highest levels of the organisation.
During 2011 there was massive upheaval in the SAPS Crime Intelligence Division as its Head Lt-General Richard Mdluli was investigated for various serious crimes including murder and corruption and faced internal disciplinary hearings and criminal charges. Political interference resulted in the investigations being halted and the charges withdrawn. The morale of this division plummeted as many police officials lost trust and respect in police leadership. Mdluli publicly accused other senior officials of conspiring against him.
Although a task team appointed by the minister of police found no evidence of such a conspiracy, still no action was taken against Mdluli for his unfounded allegations. This resulted in further mistrust amongst the generals and there was a leadership crises in the SAPS. This is one of the contributing factors to the deterioration in the performance of the SAPS against armed and organised criminals who commit many of the crimes that have now started to increase.
Crimes that decreased
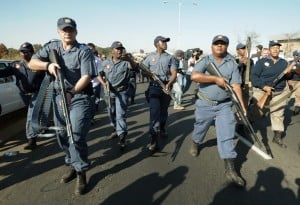
South African Police push back protesters rallying against President Barack Obama's visit to South Africa, in Soweto on June 29, 2013. Photo: AFP/Alexander Joe" />
This year there has been a reduction in some types of inter-personal violent crime, particularly assault. Assault includes cases opened as a result of domestic violence or physical alterations between people. Since most of these kinds of crimes are not reported and therefore are not recorded by the police, the reduction does not necessarily mean that there are fewer assaults taking place. It may be that fewer people are reporting such incidents to the police as they don’t believe that the police will be able to do much about it. It is a clear anomaly in the recent statistics that murder and attempted murder have both increased while the two main categories of assault have decreased. This is unusual as most murders tend to start off as an assault and therefore there is a correlation between murders and assaults.
-
Assault with the intent to cause grievous bodily harm (GBH) is a relatively serious crime as typically the victim is injured to the extent that they need medical assisstence. This crime decreased by 3.5% (or 6 758 fewer cases) to a total of 185 893 cases reported. There was a ratio of 355.6 assault GBH cases per 100 000 of the population. The ratio of this crime therefore decreased by 4.8%
-
Every day, 511 serious assaults were reported to the police on average in 2012/13.
-
Common assault decreased by 4.8% (or 8 761 fewer cases) to a total of 172 909 cases reported. This means that there was ratio 330.8 per 100 000, a ratio decrease of 6.1%.
There were decreases with regards to various robbery categories. These include the category of common robbery where the victim is not usually threatened with a weapon and three of the sub-categories of aggravated robbery.
-
Common robbery decreased by 1.1% (or 560 fewer cases) to a total of 53 540 cases reported. This means that there is a ratio of 102.4 common robberies per 100 000 of the population. The ratio decreased by a marginal 0.3%.
-
Cash-in-transit robbery decreased by 12,7% (from 166 cases in 2011/12 to 145 cases in 2012/13)
-
Bank robbery decreased by 80,0% (from 35 cases in 2011/12 to seven cases in 2012/13)
-
ATM bombings decreased by 18,0% (from 261 cases in 2011/12 to 214 cases in 2012/13)
Decreases were also recorded in violent property related crimes:
-
Arson rate decreased by 6,8%
-
Malicious damage to property rate decreased by 2,2%
A herd of sheep passes houses on June 14, 2013 in Qunu, a village outside the town of Mthatha in the Eastern Cape. Photo: AFP/ Jennifer Bruce
The following categories of theft also recorded decreases:
-
Theft of motor vehicle decreased by 1.3% or 727 fewer cases to a total of 58 370 cases reported. This means that there were 160 vehicles stolen every day on average in 2012/13.
-
Theft ‘other’ is a very broad category including the theft of a large number of different goods and property. For example, all theft of cellphones, laptops and other electronic goods, in addition to the theft of non-ferrous metals such as copper cables and the theft as a result of the illegal mining are included in this category. Theft other decreased by 3.9% (or 14 616 fewer cases) so that a total of 362 816 such cases were opened in 2012/13.
-
Shoplifting decreased marginally by 0.8% (or 539 fewer cases) to a total of 71 309 cases reported in 2012/13.
-
Stock-theft decreased by 3,4% (1 055 fewer cases) to a total of 29 894 cases reported in 2012/13.
The theft of motor vehicles and motorcycles decreased by 2,5% during 2012/2013. This is by far the smallest decrease recorded since 2006/07 (the year of the security guard strike). In the three years before 2012/13 an average annual decrease of 9,2% was recorded. Like carjacking and truck hijacking, organised crime syndicates are responsible for most motor vehicle theft.
The decrease in shoplifting is marginal at 2,1% compared to the 9,5% decrease recorded in 2011/12.
Stock theft has decreased this year by 3,4%. This could be because of the implementation of the Rural Safety Strategy. Since last year there was a small increase of 1,4% in stock theft. While this crime has only averaged around 30 000 cases per annum over the past five years, its impact on food security is significant. For traditional small farmers, especially those with cattle and goats, stock theft can cause serious tensions and even manifest in vigilantism and violent conflict which in turn results in murders, attempted murders and arson.
Explaining crime in the past year

![]()
The crime statistics presented for the 2012/13 financial year (1 April 2012 to 31 March 2013) reveals that South Africa experienced one of its worst years in a number of years from a crime reduction point of view. This is because for the past eight years between 2002 and 2011 there have been notable decreases in most crime categories. Some of the largest decreases were recorded in 2009/10 when the football Confederation Cup year was held and in 2010/11 when South Africa hosted the FIFA World Cup. However, since 2011/12 it was already apparent that the decreases previously recorded in several types of violent crime had slowed substantially while other violent crime categories (such as business and house robberies) had stabilised at relatively high levels.
The government has used crime statistics as a measure of police performance. This means that if crime goes up the police are criticised and if they go down the police are praised. But since there are a large number of crimes that the police cannot be expected to prevent, this approach means that we tend to look for solutions in the wrong places. For most types of crimes the police, courts and prisons only step in once the crime has been committed. At that stage it is very important for the criminal justice system to work effectively and efficiently. But we need to look elsewhere if we want to reduce much of the inter-personal violence in our society in the long term.

Most murders, assaults and rapes take place between people who know each other and live in the same neighbourhood. This kind of violence takes place for a number of reasons including because we accept violence as a normal and reasonable way to solve problems, at home, at school and in neighbourhoods. Poor self-esteem and unequal gender-relations make it worse. These kinds of crime are rarely premeditated and are often exacerbated by alcohol and other substance abuse. In such cases the best the police can do is to react swiftly and professionally. The most effective ways of preventing such violence typically do not involve the police, but do require long-term and the detrimental effect of apartheid social engineering on families, schools and neighbourhoods remains stubbornly persistent. It is clear that we need to do more, particularly in communities most affected by interpersonal violence to reduce the risk factors for violence, by supporting parents; offering counselling to those affected by violence; ensuring that basic services are delivered and that violence is not accepted as normal.
Good policing can have a positive effect on some kinds of crime such as organised crime and robbery. This requires the collection and effective use of crime intelligence, strategically targeted patrols, roadblocks, and visible policing along with dedicated investigations to bring perpetrators to court. These are some of the crimes that could be reduce by good policing practices:
-
Murders and attempted murders that take place during aggravated robbery or inter-group conflict (such as gang or taxi violence), and vigilantism. These type of murders typically make up between 35% and 45% of all murders and attempted murders.
-
All kinds of robbery such as street robberies, vehicle and truck hijacking, residential and non-residential robberies.
-
Residential and business burglaries.
-
Certain types of theft such as those committed by organised crime syndicates such as theft of motor vehicle and motorcycles; stock theft; theft of non-ferrous metal such as copper cable, illegal mining, and poaching.
Crimes detected as a result of police action
South African police mans a road-block and check ID's about 3km from Sandton center in Johannesburg."
Crimes such as the illegal possession of firearms and ammunition, drug-related crime and driving under the influence of alcohol or drugs are detected during police action such as roadblocks and search and seizure operations. This means that these crimes will increase if there is an increase in police activity.
In 2012/2013 the figures for both the illegal possession of firearms and driving under the influence remained stable. With regard to firearms related offences, the annual case load has remained at 14 450 per year for the past five years since 2008/2009.
Driving under the influence of alcohol showed by far the smallest increase during 2012/2013 compared to any other 12-month period over the past decade.
Drug related crime on the other hand increased by a substantial 13,5%. It was the single largest annual increase in the past decade. This indicates concerted police action against drug crimes. However, it is not an indication of the amount of drugs being used or sold. If the police are having a positive impact in removing drugs then the best indicator is that the street price should increase because demand will start to outstrip supply.
This fact sheet was prepared by the Institute for Security Studies for Africa Check. For more information including detailed crime maps for all policing precincts in South Africa please visit the Crime and Justice Information and Analysis Hub.
| This factsheet, first published on 19/09/13, was updated on 25/09/13 to reflect the changes in population data left out of the SAPS initial calculations. Therefore, the changes in ratios found in this document are different to the official SAPS changes. At the time of writing there was no indication that the SAPS would correct their calculations. The ISS has released a statement explaining the initial miscalculation made by SAPS. |
Additional reading:
FACTSHEET: South Africa’s crime statistics for April to December 2016
FACTSHEET: South Africa’s 2015/16 crime statistics
FACTSHEET: South Africa’s 2014/15 property crime statistics
FACTSHEET: South Africa’s 2014/15 assault and sexual crime statistics
FACTSHEET: South Africa’s official crime statistics for 2013/14
GUIDE: Understanding crime statistics in South Africa – what you need to know
COMMENT: The blurred crime picture – the impact of under-reporting
Add new comment