
IN SHORT: Risks to the planet increase rapidly with each increment of higher average temperature, including drought, floods, heatwaves, and rising sea levels. Global warming isn’t just about hotter weather. It’s changing Earth’s climate.
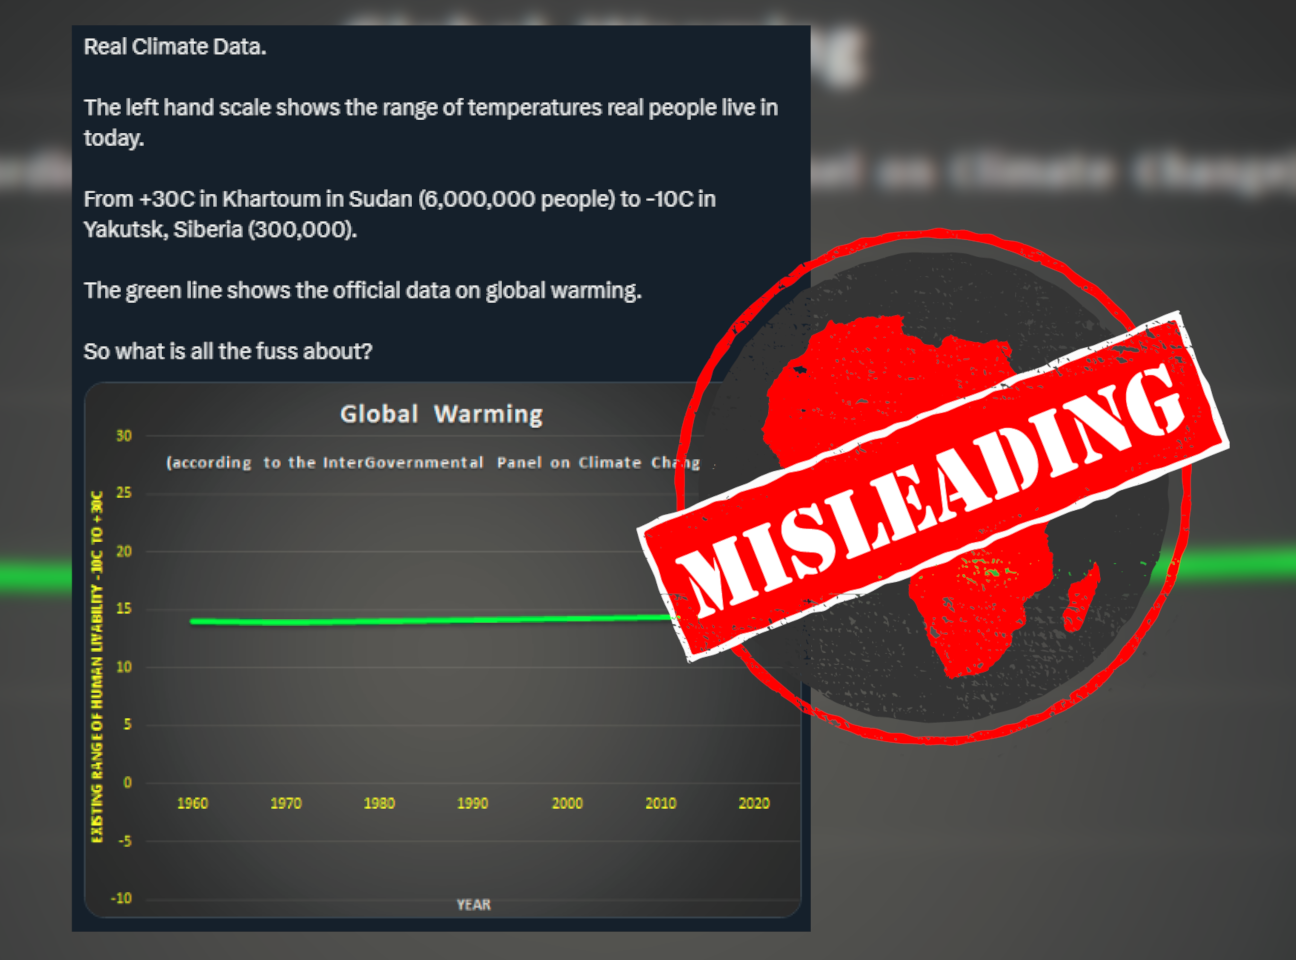
“So what is all the fuss about?”
That’s the end of a tweet that includes a graph of average yearly temperature increases.
The graph is headed “Global Warming. According to the InterGovernmental Panel on Climate Change”.
“Real Climate Data,” the tweet, also shared as a screenshot on Facebook, reads. “The left hand scale shows the range of temperatures real people live in today. From +30C in Khartoum in Sudan (6,000,000 people) to -10C in Yakutsk, Siberia (300,000).”
Khartoum is the capital of Sudan, a country in north Africa. Yakutsk is the capital of the Sakha republic in Siberia, northeast Asia. The country is part of the Russian Federation.
The scale on the left of the graph, or the Y axis, runs from -10°C (degrees Celsius) to 30°C. It’s labelled “Existing range of human livability -10C to +30C”.
The scale at the bottom, the X axis, shows the years 1960 to 2020.
“The green line shows the official data on global warming,” the tweet reads. “So what is all the fuss about?”
The graph’s broad green line is almost horizontal, rising slightly to the right.
In March 2023 the United Nations’ Intergovernmental Panel on Climate Change released its sixth synthesis report, a wide-ranging review of global scientists’ knowledge of global warming. It summarises several other reports published since 2018.
The tweet, also posted on Facebook, has been viewed more than 29,000 times and has sparked furious debate. So what is all the fuss about?
‘Large and potentially dangerous shifts in climate and weather’
The tweet misleads in several ways.
First is the graph’s “existing range of human livability”. People can survive in extremely hot and cold places, but that doesn’t mean those places are the best places for us to live.
Research published in 2020 by scientists from China, the US, the UK and Denmark found that for thousands of years, most of humanity has lived in climates with an average temperature of around 13°C. This “likely reflects a human temperature niche related to fundamental constraints”.
The scientists predict that in 50 years one to three billion people may be left “outside the climate conditions that have served humanity well over the past 6,000 years”. Their findings are summarised, with an alarming map, in a Financial Times article headlined Climate change could bring near-unliveable conditions for 3bn people, say scientists.
These regions cover northern Africa and South America, the Arabian peninsula, India and parts of Oceania.
But more importantly, the tweet and its graph ignores the huge impact small increases in Earth’s average temperature, caused by human activity, have had on the planet’s climate. As the US Environmental Protection Agency says, these “can translate to large and potentially dangerous shifts in climate and weather”.
“Risks are increasing with every increment of warming,” the IPCC says.
The tweet plots average temperature increases over a broad 40°C range, from -10°C to +30°C. This makes global warming seem like nothing.
But because small changes have large consequences, climate scientists measure temperature rise in fractions of degrees plotted on a much narrower Y axis. And the trend is upwards.
Here’s one, from the US government’s ocean and atmosphere administration’s climate website:
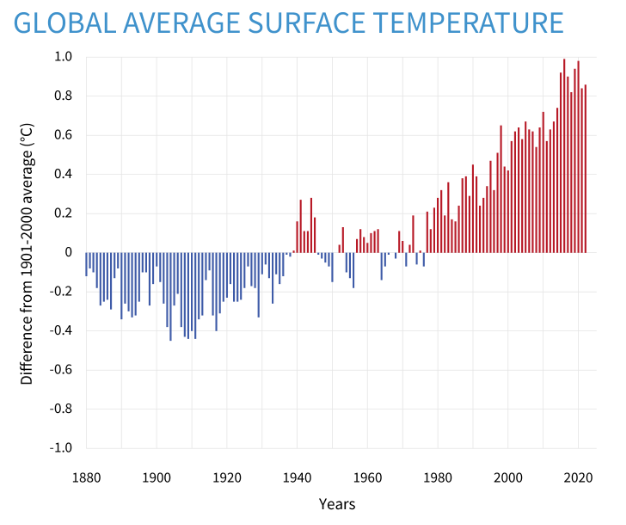
Source: Climate.gov
What the graph shows is that since about 1980, the average temperature on our planet’s surface has increased by 1°C from the average recorded throughout the 20th century. In other words, average temperatures were colder before about 1940.
Here’s another, from Our World in Data:
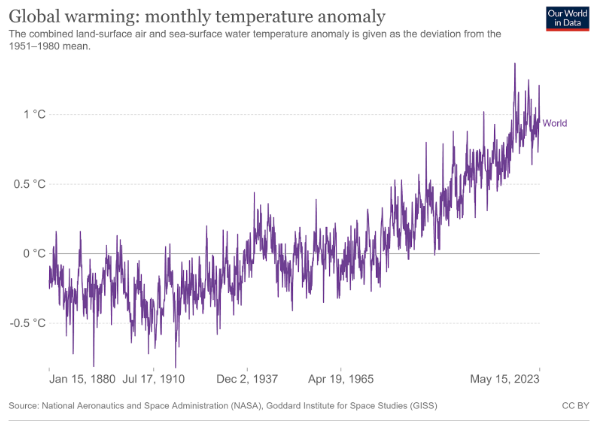
Source: Our World in Data
This shows that global temperatures have increased by more than 1°C since average temperatures were recorded from 1951 to 1980. Again, the world was colder before and is hotter now.
But what does this mean?
The IPCC’s recent reports are based on ways of predicting future changes in climate that have been accurate over the years.
Small changes in temperature make sea levels rise, melt glaciers and sea ice, and cause heatwaves and drought.
The IPCC’s reports make four predictions about what this will do to places where people live, with increases of 1.5°, 2°, 3° and 4°C. Heatwaves will become more common and intense, the soil will dry out and rainfall patterns will shift, with some regions experiencing more rain and snow and others less.
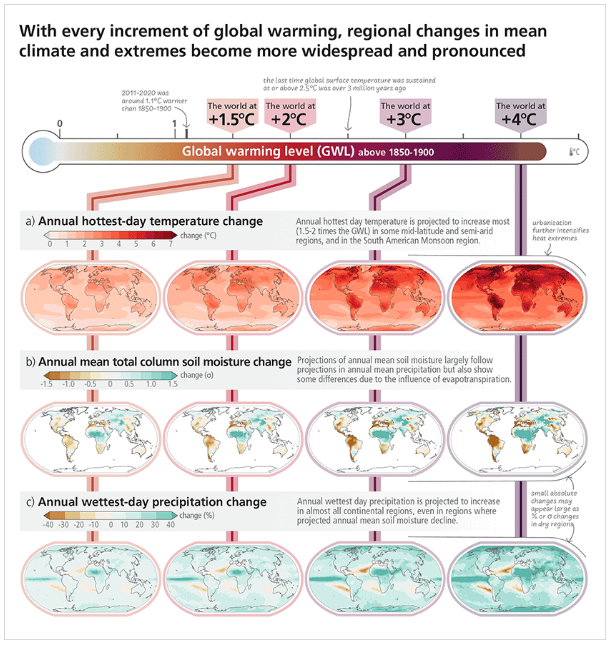
Source: IPCC Synthesis Report 2023
These effects will be stark in Africa. Most of the continent will become much drier and prone to drought, but with increased risk of sudden floods. Heatwaves will rise.
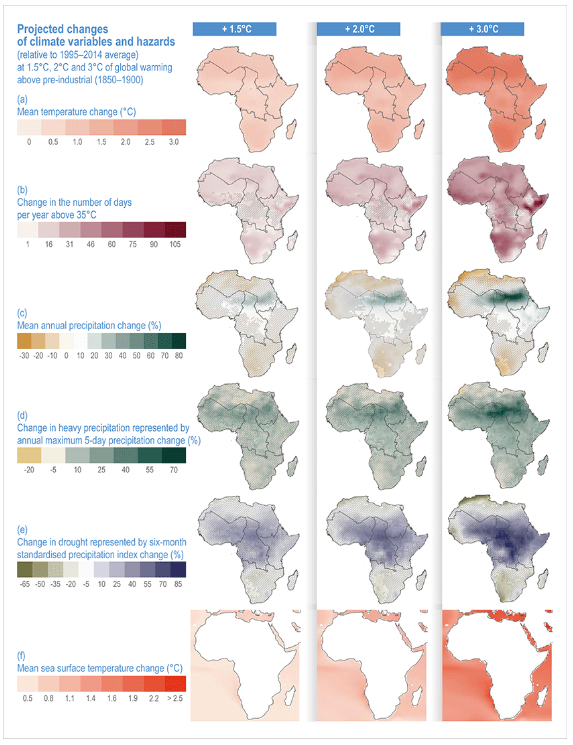
Source: Chapter 9, IPCC Synthesis Report 2023
There is clearly a great deal to be concerned about.
Republish our content for free
For publishers: what to do if your post is rated false
A fact-checker has rated your Facebook or Instagram post as “false”, “altered”, “partly false” or “missing context”. This could have serious consequences. What do you do?
Click on our guide for the steps you should follow.
Publishers guideAfrica Check teams up with Facebook
Africa Check is a partner in Meta's third-party fact-checking programme to help stop the spread of false information on social media.
The content we rate as “false” will be downgraded on Facebook and Instagram. This means fewer people will see it.
You can also help identify false information on Facebook. This guide explains how.
Add new comment