
-
Retired global strategist Michael Power's figures on the average growth of the Kenyan and South African economies over two decades were correct.
-
But South Africa's GDP in 2011 was not 10.2 times the size of Kenya’s, it was half that – 5.5 times. Also, nowhere near 86% of Kenya's workforce is tertiary educated – it's closer to 15%, while the inclusion of thermal power in his renewable energy claim made for the resulting inaccuracy.
-
However, experts caution against direct comparisons between economies – the context is very different.
“Everything keeps going right for Kenya as it consolidates its powerhouse status,” reads the headline of an opinion piece published in the Daily Maverick, a South African publication.
Written by Michael Power, a recently retired global strategist from Ninety One, a South African global investment firm, the article highlighted what Kenya was doing to strengthen its economy, geopolitical standing and attract foreign investment. On the other hand, it often indicted South Africa for slow growth or even stagnation.
Power’s article was cited in a July 2023 briefing by the Institute of Security Studies (ISS), a South African-based thinktank with which the Daily Maverick has a media partnership.
The ISS concluded that if the “quite dramatic convergence in the economic growth of the two countries' economies over the past decade continues at the same pace, South Africa could be overtaken sooner than later”.
Power’s article referred to an analysis published in Bloomberg, a US publication, and republished by the Washington Post, a US newspaper. The analysis, by Tyler Cowen, an economics professor at George Mason University, predicted that Kenya was “poised to become the ‘Singapore of Africa’”. Both articles were widely circulated in Kenya and debated.
Our artificial intelligence tools for monitoring public debate surfaced the claims made in Power's article. Although he said his article was focused on what Kenya was doing right and not on “us versus them”, Power nevertheless drew some factual comparisons with South Africa.
We took a closer look at seven of his claims.
Power told Africa Check that the data for his article was largely sourced from Trading Economics, a commercial online platform, Cowen’s article, and a March presentation by the US ambassador to Kenya, Margaret Whitman.
A country’s gross domestic product (GDP) is a measure of the size of its economy. It is the market value of all the goods and services produced in a given period, usually a year.
GDP growth is the change in a country’s economic output from one year to the next or from one quarter to the next, usually expressed as a percentage.
But has the Kenyan economy grown by at least 5% over the past two decades? This period would cover 2003, when a much-heralded new government took office, to 2022, the last full year.
For this claim, Power told Africa Check that he got his figures from Trading Economics, which says its data is based on official sources, not third party data providers, and is regularly checked for inconsistencies.
The platform lists the Kenya National Bureau of Statistics (KNBS) as its data source. KNBS data shows that Kenya's economy grew at an average rate of 4.9% over the past 20 years. In 12 of those years, GDP growth was above 5%.
Annual growth data from Kenya’s central bank puts the 20-year average at 4.7%, as does that from the World Bank. (See our workings here.)
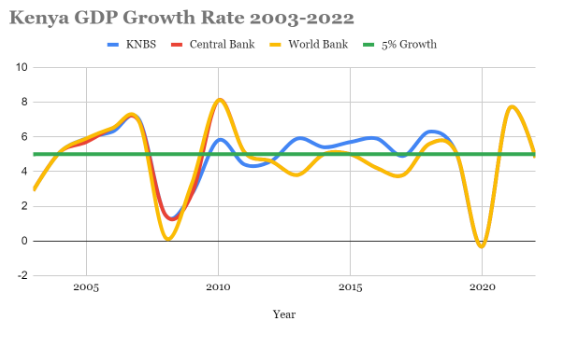
We therefore rate this claim mostly correct. – Makinia Juma
A paradox of Kenya's steady GDP growth versus people's lived experience
While the country's GDP has continued to grow over the years, many Kenyans regularly complain of hard economic times and public protests have taken place.
John Kinuthia, a lead research analyst at the International Budget Partnership thinktank in Kenya told Africa Check that Kenyans aren't feeling the effects of positive growth because of several factors.
First, the Kenyan economy is largely driven by government spending: “The government in the last few years has been spending on infrastructure and the profit is going to the ones doing the jobs, maybe for instance, say, China. We are left with the debt.”
Second, this government spending on goods and services is valued at cost rather than market prices, “and because many goods and services are not bought or sold, even though they would have a market value if they were, these goods and services are not counted in the GDP”.
Third, the exclusion of non-market activities is also an important factor: “[By this] I mean those activities that do not take place in the market, and most of them are not accounted for because of measurement problems.” This issue has been widely studied by researchers in the region.
Kinuthia concludes that even as Kenya’s GDP keeps growing “not everyone is going to feel the growth unless changes are made in the areas that drive the economy”.
South Africa’s data agency Statistics South Africa (Stats SA) has historical data on the country’s GDP since 1993. The data shows that it grew at an average rate of 2.4% between 1994 and 2022.
The International Monetary Fund also has historical data on economic growth and projections up to 2028. The data shows an average growth rate of 2.4% between 1994 and 2022, which supports the claim.
‘Context matters when comparing growth rates’
But economic context matters when comparing GDP growth rates across countries, says Noah Wamalwa of the Institute of Economic Affairs Kenya, a public policy thinktank in Nairobi.
This echoes what analysts have often told Africa Check, cautioning against direct comparison of GDP figures across countries. (See our 2016 report Is Africa’s entire GDP equal to that of France?)
South Africa’s economy is driven by manufacturing, finance, agriculture, and mining, while Kenya's economy is heavily dependent on agriculture, transport and storage, and real estate.
Wamalwa noted that South Africa’s economy is larger than Kenya’s, so while the Kenyan economy is growing faster, the actual growth in the size of the economy is less than that of South Africa.
Put another way, according to the World Bank’s data, adjusted for inflation and price changes between 2021 and 2022, South Africa’s GDP grew by US$7.2 billion while Kenya’s grew by $4.4 billion. Yet this translates into a higher growth rate of 4.9% for Kenya to 2% for South Africa.
However, rapid growth in a smaller economy can lead to significant improvements in living standards, even if absolute GDP remains lower than in a larger economy, Wamalwa said. On the flip side, slower economic growth can also mean that living standards rise more slowly.
Wamalwa also noted that comparing a 28-year period between 1994 and 2022 with a 20-year period between 2002 and 2022 could paint a misleading picture because it omits key events that could affect growth, such as the structural adjustment programmes of the 1990s. – Makinia Juma
John Kinuthia, a senior programme officer at the International Budget Partnership Kenya, a global organisation that promotes budget transparency, also advised caution when converting currencies.
"Because we measure GDP in a country's currency, in order to compare the GDPs of different countries, we have to convert them into a common currency. A country's GDP is measured in its own currency: Kenya uses the Kenyan shilling, South Africa uses the rand,” Kinuthia told Africa Check.
When comparing the GDP figures of two countries, it is best to use GDP adjusted for inflation and price changes or GDP at constant prices, Wamalwa of the Institute of Economic Affairs told Africa Check.
GDP at constant prices gives a better picture of an economy by removing the effect of changing prices, making it easier to compare how well economies are doing over time and between different countries.
We found GDP data obtained from national statistical offices and converted into US dollars by the World Bank. “Dollar figures for GDP are converted from domestic currencies using 2015 official exchange rates,” the development lender noted.
The data shows that in 2011, South Africa’s GDP was $321.5 billion, while Kenya’s was $58.6 billion. South Africa’s economy was therefore 5.5 times, not 10.2 times, larger than Kenya’s. – Makinia Juma
The price-adjusted GDP in 2021 is $353.26 billion for South Africa and $90.41 billion for Kenya, giving a ratio of 3.9.
This claim is correct. – Makinia Juma
The unemployment rate in a country is defined as the proportion of people who don’t have a job and are available and willing to work. This is then expressed as a percentage of the labour force, which includes all employed and unemployed people.
Trading Economics says it has data on 196 countries. It puts South Africa’s unemployment rate at 32.9% in June 2023 and Kenya’s at 4.9% in December 2022.
South Africa’s rate on the platform is the same as that put out by the national statistics office for January to March 2023. On 15 August, Stats SA published new data which put the unemployment rate at 32.6%.
The figure of 4.9% for Kenya (and 13.9% if the “expanded” definition of unemployment is considered) remains the most recent by its statistics office.
So the claim as stated adds up.
Does the data compare apples to apples?
The ISS spoke to two experts for their brief, who drew attention to the dominant position of agriculture in the Kenyan economy, accounting for 30% of total employment, compared with about 5.5% in South Africa.
The ISS also quoted Kevin Ling, chief economist at South African asset management firm Stanlib, as saying that Kenya seemed to take a “lenient approach to classifying someone as employed”.
The (near-similar) approach to measuring unemployment in both countries can be found here for South Africa and here for Kenya. We have also asked the data agencies whether these two factors are relevant to the final rate. We will update this report when we hear back. – Grace Gichuhi
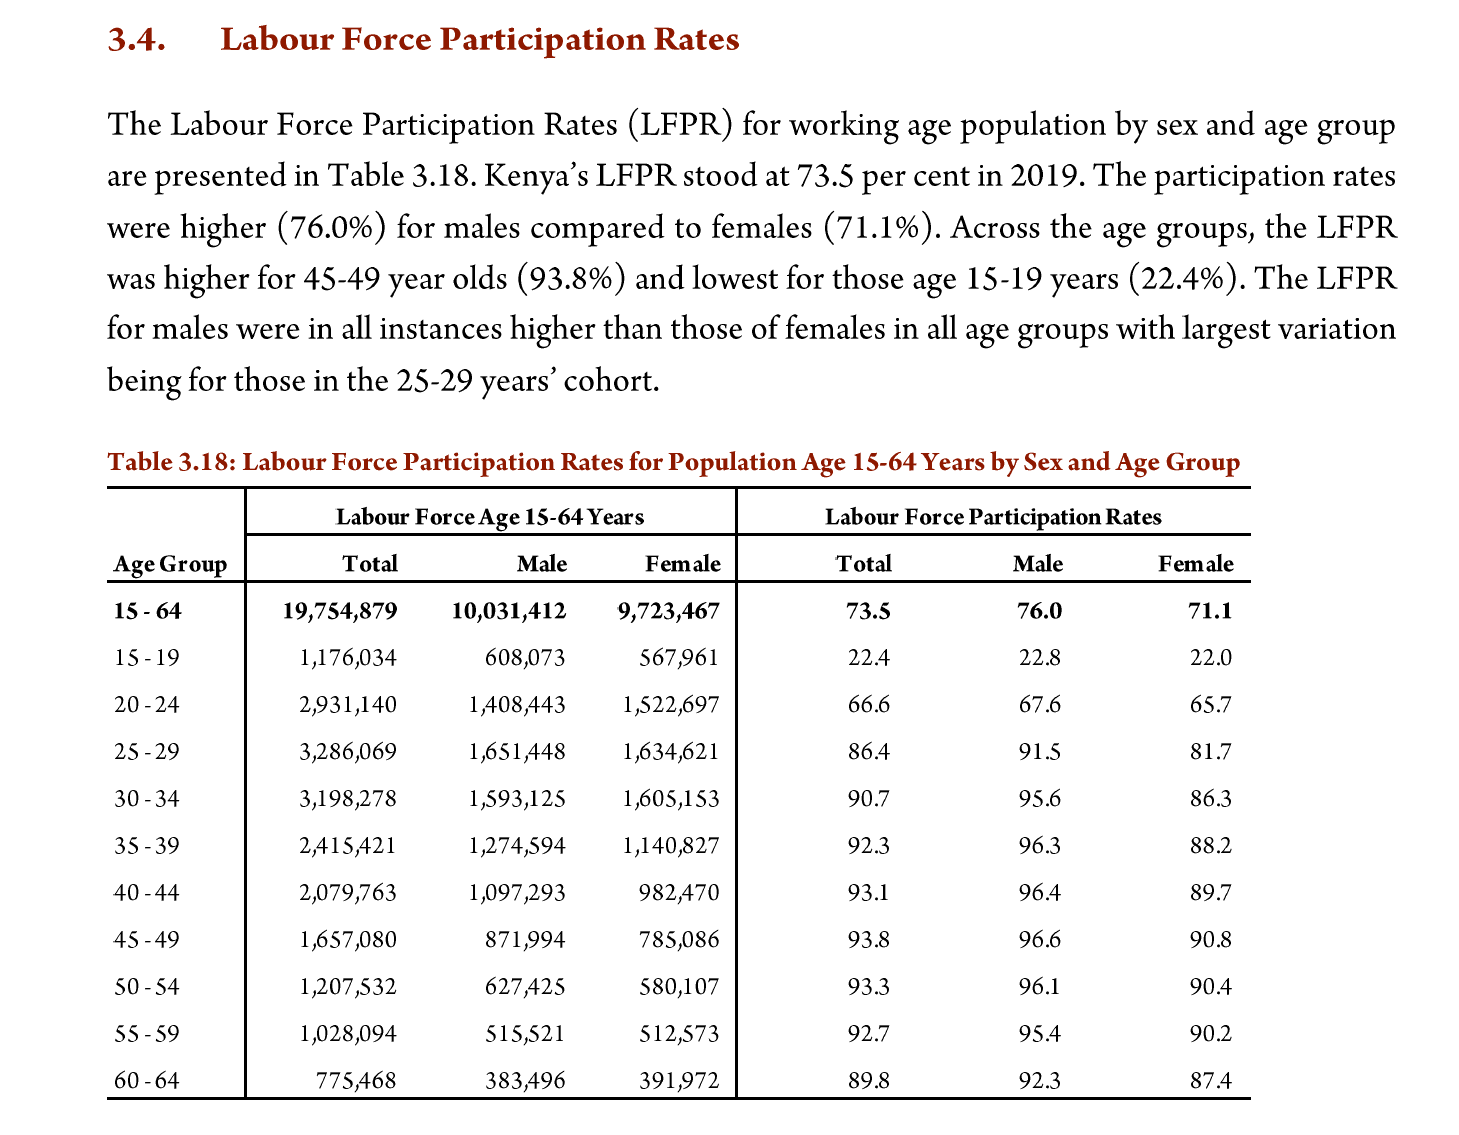
Post-secondary education, also known as tertiary education or higher education, refers to formal learning that takes place after the completion of secondary education. It takes place in technical training institutes, vocational schools, colleges and universities.
The workforce, or labour force, refers to the economically active population that is either employed or unemployed and available for work.
In September 2022, Kenya's statistics bureau published labour force data based on the 2019 national census. The census put the number of Kenyans with post-secondary education at 4.27 million. Some of these are over the age of 64 and therefore outside the labour force.
Analysis of the census results shows that out of the 17 million people aged 15 to 64 who were listed as employed in 2019, only 2.6 million had attended mid-level or technical and vocational training colleges and universities. This was 15.4%.
Of the 2.7 million listed as unemployed, some 374,432, or 13.8%, had a post-secondary education.
In total there are 3 million Kenyans with post-secondary education in a labour force of 19.8 million people – or 15.2% of the labour force.
Therefore, we rate the claim as incorrect. – Tess Wandia
Kenya’s Energy and Petroleum Regulatory Authority publishes regular power generation statistics. The latest report covers the second half of 2022 and shows the contribution of different energy sources.

Electricity generated from the three sources Power mentioned was 30.55% – solar (2.9%), wind (17.22%) and thermal (10.43%). Thermal energy comes from fossil fuel generators, and is fed into the national grid to boost supply when generation from other sources falls. It is not a renewable energy source.
Kenya generates an estimated 87% of its electricity from renewable sources, according to the regulator's latest report.
We therefore rate this claim as incorrect. – Tess Wandia
Republish our content for free
Further Reading

GUIDE: Understanding crime statistics in South Africa - what you need to know
This guide, published by Africa Check in cooperation with the Institute for Security Studies, explains what a reader needs to know to unders...

The politics of crime statistics
Who owns crime statistics? "In South Africa, the crime statistics are seen as information that belongs to the police which they reluctantly


Add new comment