
- The president’s claim that multidimensional poverty had gone down is reflected in the available data, which saw the poverty rate, according to the South African Multidimensional Poverty Index (SAMPI), decrease from 17.9% in 2001 to 7% in 2016.
- However, the rate of the decline slowed significantly between 2011 and 2016, and crucially, there are no recent up-to-date figures, making it impossible to prove that multidimensional poverty “continues to move further down”.
- There are a number of complex ways to measure poverty quantitatively, and qualitative research, not reflected in these statistics, reveals even more detail about living in poverty.
With 2024 elections looming, South Africa's ruling African National Congress (ANC) is gearing up to campaign.
In July 2023, the party met to review progress on its 2019 manifesto, in which it promised to address the triple challenges of unemployment, poverty and inequality.
At the end of the meeting, Cyril Ramaphosa claimed to have achieved significant success. He is the president of the country and the ANC. Multidimensional poverty in South Africa, he said, had “really gone down”, decreasing from 17.9% to 7%, and was “continuing to move further down”.
Ramaphosa attributed the claim to Risenga Maluleke, head of Statistics South Africa (Stats SA), the country’s data agency.
A number of readers asked us to look into Ramaphosa’s claims about poverty reduction, and so we did.
Headcount poverty, or the poverty rate, is a common measure of the proportion of individuals or households in a population below a specified poverty threshold.
Poverty is a broad phenomenon, defined by the World Bank as a “pronounced deprivation in well-being”.
There are many different forms of poverty and ways to measure it. Poverty can be absolute, meaning below a pre-defined level of what is needed to survive, or relative, meaning deprivation compared to other people at the same time.
Stats SA is responsible for measuring poverty in simple economic terms. To do this, it uses three poverty lines. These estimate the amount of money someone needs each month to afford certain necessities. Stats SA regularly updates the national poverty lines to reflect the changing cost of basic necessities. The latest poverty lines are based on prices in April 2022, although an update is expected in late August 2023.
According to the most recent data available, more than half (55%) of the population lived below the upper bound poverty line in 2015. These were poor people who could afford a list of basic essential food and non-food items, at a cost of R992 per month.
A quarter of the population (25.2%) lived in extreme poverty, on R441 per month. This was the estimated amount needed to meet the minimum daily energy requirement.
Developing a multidimensional approach to poverty
While poverty lines are an efficient way of measuring absolute poverty in financial terms, researchers have long argued that they only capture a partial picture of the issue.
As Stats SA explains, having an income indicates the means to achieving a better life, but is not the better life itself. Similarly, having a certain amount of money each month that in theory enables someone to afford basic food items does not capture the complexity of poverty, which can affect some or all aspects of daily life differently.
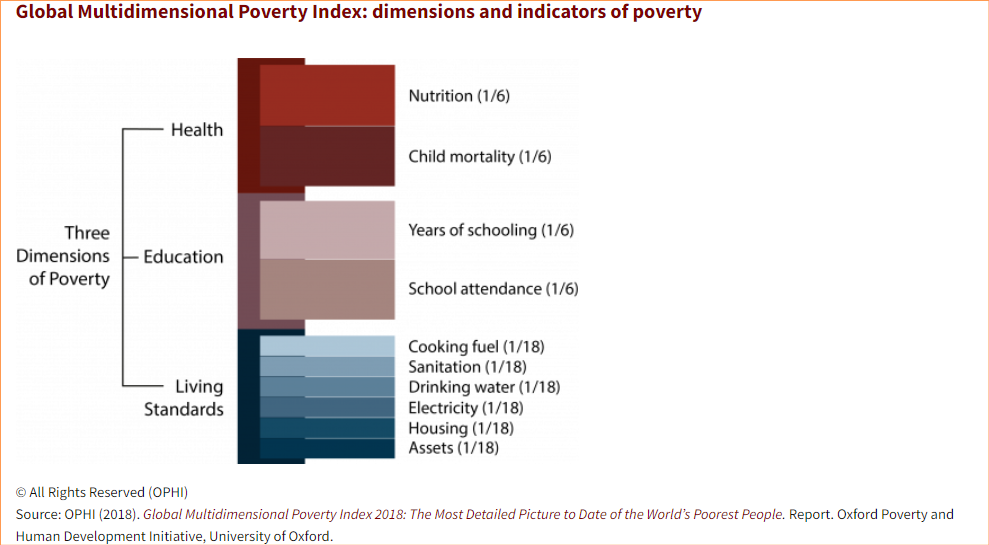
In line with this thinking, the Oxford Poverty and Human Development Initiative at the University of Oxford in the UK and the United Nations Development Programme developed the global Multidimensional Poverty Index (MPI) in 2010.
The index measures poverty in three dimensions – health, education and living standards – at the level of the individual. If someone is deprived in a third or more of the ten indicators, they are considered “MPI poor”.
In 2014, Stats SA developed its version of the index, the South African MPI or SAMPI. The data agency said the index’s ability to break down poverty into different dimensions would allow for better allocation of resources, so policy could be more targeted.
What the SAMPI tells us about poverty
The SAMPI is calculated using data from community surveys, which look at a representative sample of the population and national census data. It is similar to the global MPI, with some changes to account for specific conditions in South Africa. For example, the SAMPI includes a fourth economic dimension that measures unemployment.
As with the global MPI, a household is considered multidimensionally poor if it falls below the threshold on at least a third of the indicators. All four dimensions are weighted equally, meaning that they all contribute equally to the overall score. All indicators within each dimension are also weighted equally.
According to Stats SA’s calculations, the total percentage of people considered multidimensionally poor in South Africa in 2001 was 17.9%. By 2011, this had more than halved to 8%. Five years later, in 2016, it had fallen by one percentage point, to 7%.
This means Ramaphosa’s claim on multidimensional poverty is correct if looking from 2001 to 2016.
An incomplete picture
But as is sometimes the case with statistics shared by the government to show social progress, there’s nuance missing.
“There is nothing wrong with saying poverty decreased, but a different matter is 'decreased by how much?’” Derek Yu, a professor of economics at the University of the Western Cape (UWC), told Africa Check. He researches labour and development economics in South Africa.
Looking at the trends in headcount poverty as measured by the SAMPI, the rate of decline has slowed over the years. The graph above shows that headcount poverty fell by almost 10% in the decade from 2001 to 2011, but only by 1% in the five years from 2011 to 2016.
According to Stats SA, the significant decline between 2001 and 2011 could be because of redistribution programs like social grants, no-fee schools, compulsory education, feeding schemes and access to free basic services. On the other hand, unemployment has steadily increased.
And while the above headcount measure reflects how many South Africans are multidimensionally poor, the SAMPI also measures the intensity of that poverty. It does this by looking at the average proportion of indicators a household is deprived in.
Over the same period, despite the large overall decrease in headcount poverty, the reduction in the intensity of poverty did not follow the same trend. In 2001, poverty intensity was measured at 43.9%. It fell to 42.3% in 2011, and then rose slightly to 42.8% in 2016. This means that between 2001 and 2016, as Stats SA puts it, “the circumstances of the poor hardly got better”.
Andries du Toit, the director of the Institute for Poverty, Land and Agrarian Studies at UWC, highlighted another challenge in measuring poverty with the SAMPI. Although the index “goes well beyond the limitations of simple monetary indicators”, such as poverty lines, measures of multidimensional poverty “can only tell you part of the story”, he told Africa Check.
He stressed the need for qualitative ways of looking at poverty. Unlike quantitative research, which tries to capture a phenomenon by looking purely at numbers, qualitative investigations go deeper, looking at the context and people’s individual experiences. This research is often described as answering the “why” and “how” questions, beyond the “what” question that quantitative data can answer.
This way of measuring poverty was crucial, Du Toit said, in addition to quantitative measures such as the SAMPI, because “qualitative information … tells you more about the lived relationships and processes that drive poverty and how it impacts on people’s lives”.
While there has been a decline in multidimensional poverty between 2001 and 2016, Ramaphosa also claimed that this measure continues to decline.
However, Stats SA has not published SAMPI calculations since 2016. This was the most recent published estimate, Werner Ruch from the agency’s poverty and inequality statistics unit, told Africa Check.
“Stats SA will publish an updated SAMPI headcount linked to 2022 after the organisation publishes the census 2022 results,” he said.
Initially delayed, the census results are expected to be released before October 2023.
Until this data is published, this particular claim remains unproven.
Republish our content for free
Further Reading

FACTSHEET Why do Nigeria's doctors feel unloved?
Doctors in Nigeria have recently ended a strike. But what are the key issues that inform the regularity of work boycotts in the country’s pu...


Add new comment