-
Zibi was correct about the backlog in issuing mining licences, despite the South African economy’s reliance on this sector, and that unemployment was higher in 2024 than in 1994.
-
The party leader was also on the money when it came to South Africa spending more on servicing national debt than on policing, health or infrastructure, while also splashing out R2 billion a year on protection services’ blue-light brigades for politicians and VIPs.
-
He also correctly stated violent crime is worse today than 20 years ago, but his statement that 48 out of every 100 kids who started school in 2012 did not matriculate in 2023 is misleading.
The newly formed Rise Mzansi party launched its election manifesto in January 2024.
We fact-checked seven claims made in the document and found that the party was correct in its claims about unemployment in South Africa, including that it affects black women the most.
The party's claims about hunger, disability and inequality were less definitive.
Launching the manifesto, party leader Songezo Zibi said South Africa was in serious trouble: “Although many people believe politics is a game of promises, smoke and mirrors, to us this is no game. This is a life and death situation.”
Zibi supported this statement by making several claims about where the country stood. We take a closer look at them in this report.
Speaking about the party’s plan to “remove obstacles to investment and support small businesses and entrepreneurs”, Zibi said there was a backlog of over 2,000 mining licences in the country.
South Africa’s mining industry employed just under 450,000 people between October and December 2023 and contributed 58% of the country’s total exports in the first six months of the same year. No person or organisation can legally mine or prospect in South Africa without a mining licence issued by the department of mineral resources and energy.
Rise Mzansi said the source of the claim was an article published on 15 January 2024 by Miningmx, an online African mining news and analysis publication.
According to Miningmx, 2,525 mining permits were not processed in the 2023/24 financial year. The source of the figure, according to the article, was a report by South African news site Daily Maverick.
According to the Daily Maverick, mineral resources minister Gwede Mantashe said in a written response to a question in parliament on 8 December 2023 that 2,525 applications for mining licences were received in the 2023/24 financial year and that none had been finalised.
Mantashe gave an update on the backlog on 5 February at the mining indaba, an event dedicated to the development of mining interests in Africa. He said that his department had, since December, granted “268 prospecting rights, 32 mining rights, 85 renewals, 184 amendments, and 190 permits”.
While some progress has since been made, Zibi’s claim was correct when he made it.
As evidence for this claim, Rise Mzansi referred us to the national treasury’s latest budget statement for figures on debt service costs. The treasury defines this as the cost of interest on government debt.
According to the foreword to the statement, written by finance minister Enoch Godongwana, for every R5 the government collects in revenue, it spends R1 on servicing its debt. Rising debt costs, he said, now consume more of the budget than basic education, social protection and health.
According to expenditure figures in the 2023/24 budget, the government was expected to spend R340.5 billion on debt servicing. This compares to R259.2 billion allocated to health. Just under R228 billion was allocated to peace and security, which includes police services. Almost R238 billion was allocated to economic development, which includes infrastructure.
The treasury expects debt servicing costs to rise to R385.9 billion in 2024/25 and R425.5 billion in 2025/26. These rising figures crowd out spending on service delivery, it says.
Rise Mzansi’s claim about South Africa’s debt servicing is correct.
Rise Mzansi steered us to World Bank data showing unemployment as a percentage of the labour force over time. The labour force is the part of the population that is or wants to be economically active. As we’ve written before, employment experts say this is a more useful measure of unemployment trends than using raw numbers, because the latter doesn’t take into account changes in the labour force.
The source of the World Bank data was the International Labour Organization (ILO). The data shows that in 2003 the proportion of the labour force that was unemployed was 20%. By 2022, the latest year for which data is available, this had risen to 29.8%.
These figures come from Statistics South Africa’s labour surveys. Although the ILO rates are slightly different, the trend is the same – the proportion of the labour force that was unemployed has generally increased since 2003. (To explain the slight difference, the ILO said different analyses were carried out compared to national statistics.)
As Africa Check has previously reported, it is difficult to compare data before and after 2008 because the surveys used to measure unemployment changed in 2008. Stats SA has published revisions to some pre-2008 unemployment data which are more comparable. The revised official unemployment rate was recorded as 24.8% in 2003, compared to 31.9% in 2023.
The expanded unemployment rate, which includes people who aren’t actively looking for work, is another indicator used by Stats SA. However, without revised expanded rates for pre-2008 data, comparisons between then and now are not straightforward.
Are we asking the wrong questions?
While unemployment appears to be higher than it was 20 years ago according to the comparable data available, there may be more to the story. Dr Neva Makgetla, senior economist at the Trade and Industrial Policy Strategies research institute, told Africa Check that unemployment data tells us “what people want and are looking for” rather than if people have income-generating work.
In terms of measuring demand for work, Makgetla said the official definition of unemployment could be used. But when looking at exclusion from the economy, the absorption rate is a better indicator as it measures how much of South Africa’s working-age population is employed. According to revised statistics, the absorption rate has been relatively stable since the early 2000s, largely in the 40 to 45% range, with a dip during the Covid pandemic.
“Blue light brigades” is the informal term used in South Africa for the escort and protection services that accompany politicians, visiting diplomats and other influential people on the roads. The services are called this because of the blue lights on their vehicles.
Officially, “blue light brigades” are a specific programme of the South African Police Service (SAPS) known as VIP protection services.
Blue light brigades have been controversial for decades. In a July 2023 incident, the protection unit of deputy president Paul Mashatile was filmed assaulting civilians on a busy South African highway.
Rise Mzansi referred Africa Check to national treasury expenditure estimates as the source of its claim. These estimated that about R1.97 billion was spent on VIP protection services in the 2022/23 financial year, an increase on the previous years’ expenditure of R1.86 billion (2021/22), R1.66 billion (2020/21) and R1.85 billion (2019/20).
The treasury estimated that this expenditure would increase in subsequent years, exceeding the R2 billion mark in 2024/25.
With previous years rounded up to two billion, including the outlier year 2020/21, which included the start of the Covid pandemic and associated travel restrictions, we rate this claim as correct.
Rise Mzansi said it relied on statistics from the Crime Hub, a database run by the Institute for Security Studies (ISS), an independent research organisation based in Pretoria. The party said it had used murder “as a proxy for violent crime” in making this claim.
Violent crime, classified by the South African Police Service (SAPS) under “contact crime”, includes offences such as murder, rape, assault and robbery. While the SAPS reports statistics on all contact crimes, there is often a gap between the number of crimes committed and how many are reported to the police or other organisations. This is estimated to be the case for many crimes, particularly rape and assault, for a variety of reasons.
Under-reporting of murders is less common. This is because murder statistics can be independently tracked and verified, Gareth Newham, head of the ISS Justice and Violence Prevention Programme, told Africa Check.
“Dead bodies are hard to hide, dispute or ignore,” says the ISS. And comparing police murder rates with mortuary records suggests that police statistics are likely to be relatively accurate. This means that murder is considered “the most reliable crime indicator”, Newham said, so trends in murder rates are often used as a proxy, or representation, of the larger trends in violent crime.
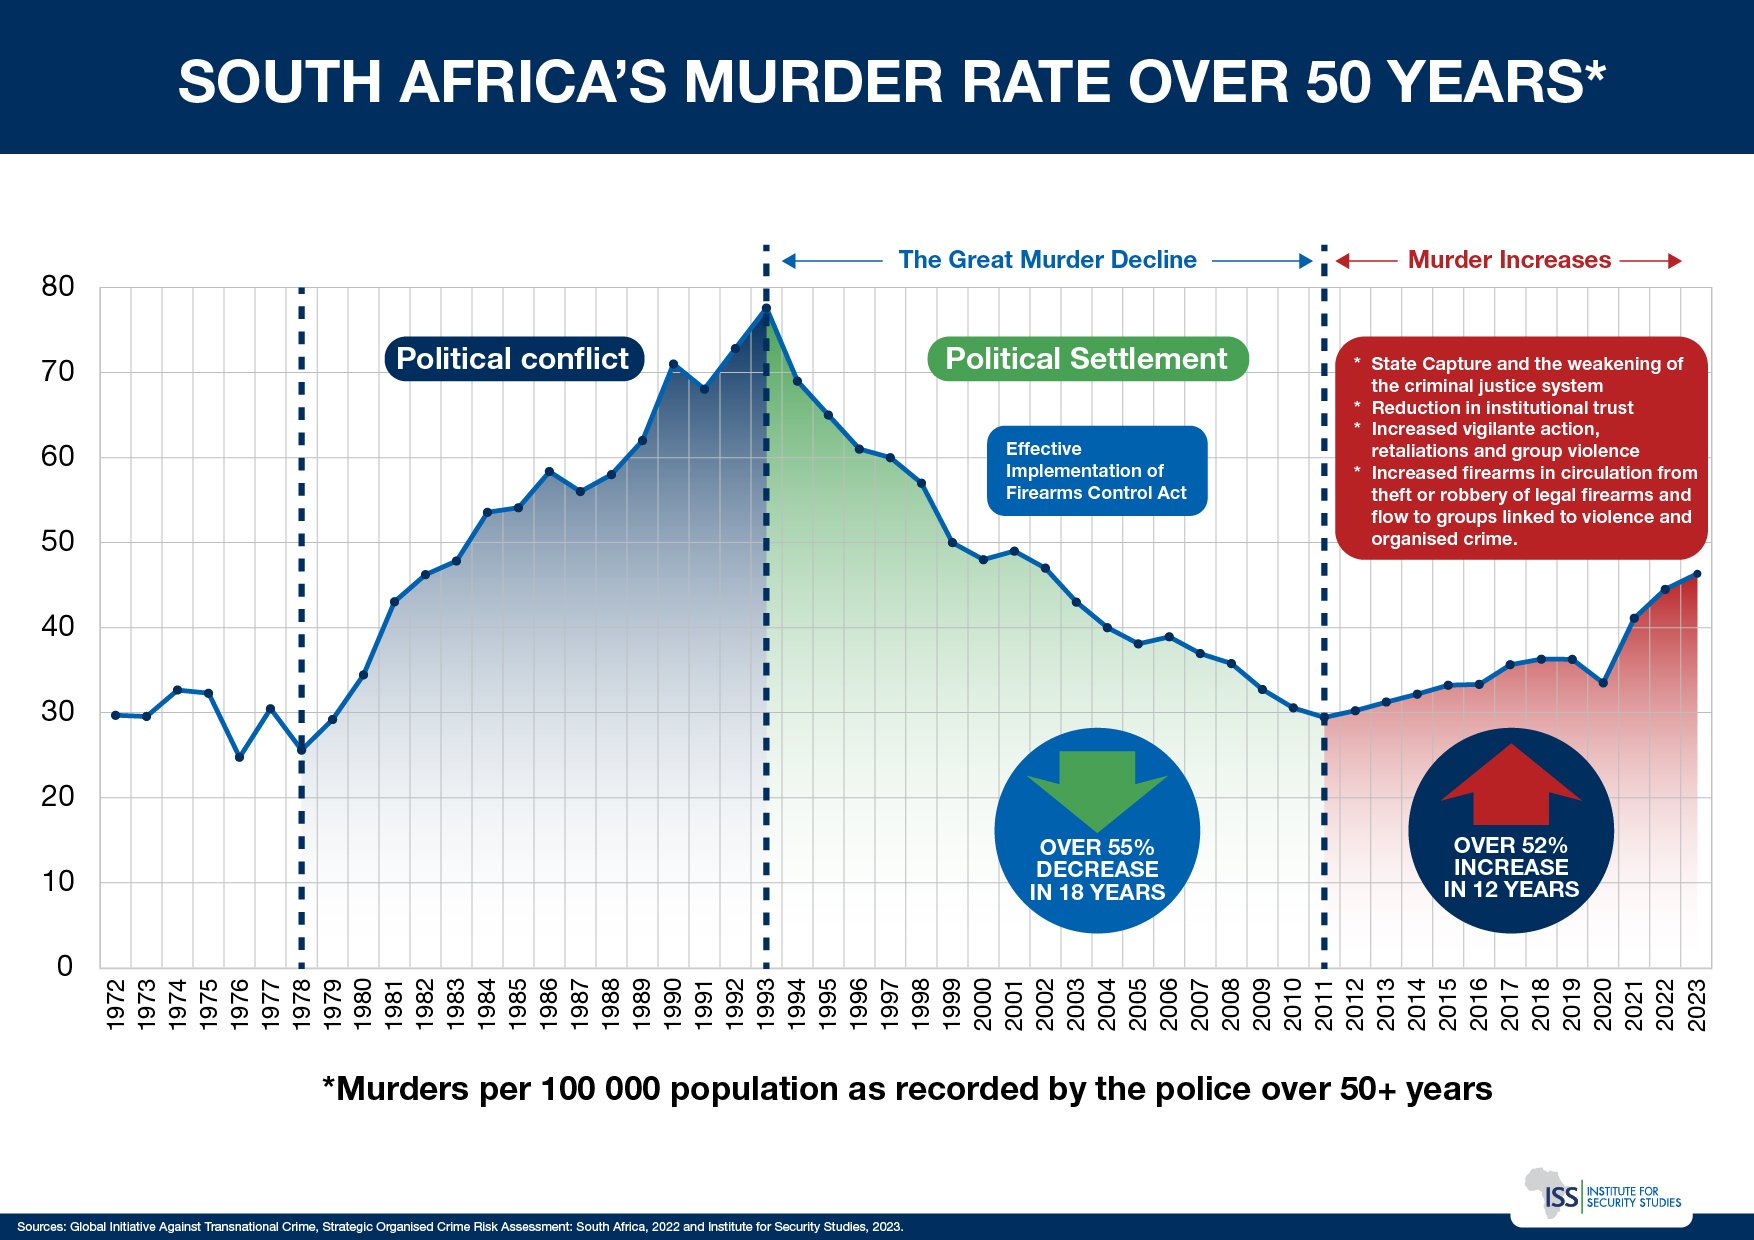
According to police crime statistics, more than 27,000 people were murdered in South Africa in 2022/23. However, to compare this with previous years, changes in the population must be taken into account. To do this, experts usually report the number of murders per 100,000 people in the country. In 2023, the murder rate was 45 per 100,000, slightly higher than the United Nations Office on Drugs and Crime estimate of 41 per 100,000 in 2003.
The larger trend
The ISS has analysed murder trends in South Africa since the 1970s. As Africa Check has previously reported, the murder rate fell steadily from the end of the apartheid era, more than halving between 1994/5 and 2011/12. But in the years since, the rate has risen almost every year, increasing by over 52%.
According to Newham, the police’s ability to solve murders declined during this period, despite significant increases in its budget. He added that the SAPS was plagued by an “inability to address deficiencies in recruitment, training, resource allocation, performance management and accountability”.
For Newham, this means that although the murder rate is only slightly higher in 2024 than it was two decades ago, the trend is clear: violent crime is worse now than it was 20 years ago.
He added that over the past two decades, more violent crime appeared to be the result of organised crime and inter-group violence than interpersonal violence: “Increasingly, illegal mining, taxi violence, hijackings and other robberies are driving the increase in murders.”
There were also more mass shootings, where three or more people were killed in one incident, and more vigilante killings as public trust in the police declined, Newham said. At the same time, the state’s intelligence and policing capabilities were “much stronger” 20 years previously than in 2024, as a result of state capture.
South Africa’s high school leaving qualification is known as “matric”, formally the national senior certificate (NSC).
In January 2024, basic education minister Angie Motshekga announced that 82.9% of learners who sat the NSC exams in 2023 had passed, which was a record pass rate.
The matric pass rate is a contested topic in South Africa: some opposition political parties and non-governmental organisations claim that this pass rate ignores the number of learners who dropped out of school before reaching matric. They say that the “real matric pass rate” should be calculated by dividing the number of learners who completed matric by the number who entered grade 1, 12 years earlier.
For example, in the case of the class of 2023, 572,983 learners obtained their NSC, but 1,208,973 enrolled in grade 1 in 2012. This means that only 47% of the cohort successfully reached grade 12 and completed their high school education, which is very close to Zibi’s claim.
However, the basic education department has challenged these calculations, arguing that they ignore various factors that lead to a decline in the number of learners – in particular, learners repeating grades.
Instead, the department calculates the dropout rate by subtracting the percentage of learners who completed the previous year’s grade from the percentage who enrolled in the following year’s grade. For example, if 70% of the learners who passed grade 5 enrol in grade 6, the dropout rate for grade 5 would be 30%.
Particular attention is paid to grade 7, the level the department uses as a measure of literacy; grade 9, the final year of compulsory education; and grade 12, the completion of the cohort’s basic education.
Survival rates v dropout rates
Rise Mzansi said its source for the claim was a 2024 report by Zero Dropout, a national campaign to reduce dropout rates.
The latest report on the Zero Dropout website is from 2023 and claims that “only 40% of learners that begin grade 1 complete matric”. It attributes this statistic to a 2023 report by the basic education department and Stats SA.
The report does include a section on dropout and survival rates.
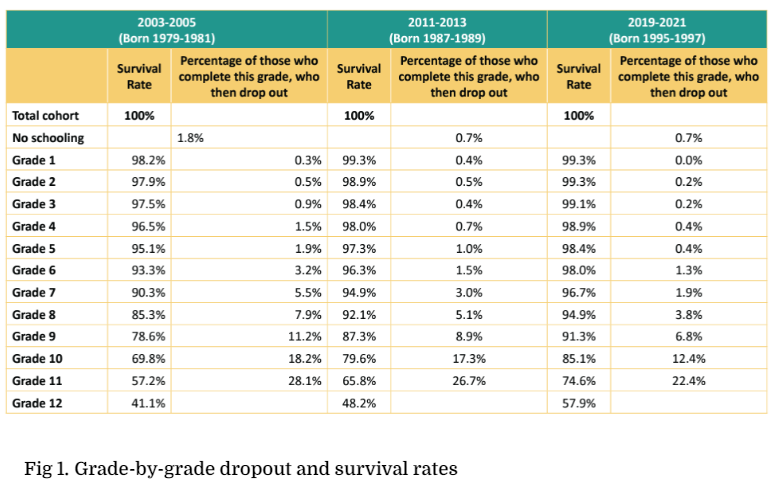
According to the report, the survival rate per grade is the percentage of a cohort of learners enrolled in the first grade in a given school year who are expected to reach a given grade. As shown in the table above, the survival rate for learners born between 1995 and 1997 (and surveyed between 2019 and 2021) was 99.3% when they entered grade 1. This figure decreases with each grade, gradually at first and then quite sharply from grade 9 onwards.
But the survival rate is not the same as the dropout rate, also shown in the table. This is defined in the report as the percentage of all people who complete a particular grade and complete no further education. In other words, they are assumed to have dropped out after that grade.
The table above shows that the percentage of learners completing grade 12 has increased over time, from 41% for those born between 1979 and 1981 to 58% for those born between 1995 and 1997. In contrast to the dropout rate, this measure gives a better indication of the proportion of young people who eventually pass matric.
We therefore consider this claim to be misleading.
This report is produced as part of the work of a South African election coalition. In the run-up to the 2024 national elections, the coalition aims to ensure that the claims made by those in charge of state resources and delivering essential services are factually accurate. As voters head to the polls, it is increasingly important that they are able to make informed decisions.
You rely on us for factual information, we rely on you.
We depend on donations to bring you quality, fact-based information and keep public figures accountable.
Support trusted sources of informationRepublish our content for free
Further Reading

#ManifestoCheck: Verifying 9 claims from the Democratic Alliance’s ‘Rescue Plan for South Africa’
Did the Democratic Alliance get its facts right when it outlined how it would tackle several problem areas if it were voted into power?

‘Our land and jobs now. Stop load shedding!’: Fact-checking four big claims in the Economic Freedom Fighters’ 2024 election manifesto
In a manifesto brimming with promises, Africa Check took a closer look at some of the more notable claims the opposition party made.

‘For the people, by the people’: Fact-checking 7 claims in Rise Mzansi’s election manifesto
As it set out how it would govern effectively, did the newcomer to South Africa’s political scene nail all of its facts?


Add new comment