
-
The party was correct to claim that South Africa’s three wealthiest billionaires own more wealth than the poorest 26 million South Africans.
-
Claims that an average of 20,000 murders are committed each year and that a dehumanising sanitation system of bucket toilets still exists in the country also checked out.
-
But the EFF fell back on an old manifesto to rehash an incorrect claim that 80% of South Africa’s population occupies less than 10% of the country’s land. This claim was false in 2019, and it is false now.
South Africa’s second largest opposition party, the Economic Freedom Fighters (EFF), launched its election manifesto on 10 February 2024, titled Our Land and Jobs Now. Stop Loadshedding!
Here the EFF lays out its commitments in seven key areas, which it said were based on submissions, the founding manifesto, and the party’s collective experience so far:
- expropriation of land
- nationalisation of strategic sectors of the economy
- building state and government capacity
- free quality education, health care, housing and sanitation
- protected industrial development
- development of the African economy
- open, accountable, corrupt-free government
As with other political party manifestos, Africa Check set out to fact-check the claims made in the document. However, we faced two notable challenges.
First, the manifesto is rich in promises (the word “will” appears over 1,700 times). It’s perfectly normal for a party to make pledges during election season but we can’t fact-check claims about the future.
Second, despite numerous attempts to contact the party about the claims it presents as fact, we have had no response to our enquiries yet. This means that there are no data sources for some of the more general claims, such as the EFF “effectively gave land to 50,000 people who were landless”.
In 2019 when we checked its election manifesto the party provided the requested details. That document was similarly titled to 2024’s: Our land and jobs now!
Nonetheless, we were able to verify the following claims using publicly available information.
The manifesto begins with a foreword from party leader Julius Malema.
The emphasis on land, Malema writes, is “from the fact that 30 years since the attainment of political freedom, 80% of the population continues to occupy less than 10% of South Africa’s land”.
We fact-checked this claim when it appeared in the EFF’s 2019 election manifesto and found it to be incorrect. Before we explain why it’s still inaccurate, it’s important to understand the terms used.
In terms of sheer area, hardly any of South Africa’s 122 million hectares (ha) of land is “occupied”. According to Statistics South Africa (Stats SA), the national data agency, only 2.6% of the country’s land was “built up” in 2014, meaning that it had been developed into mines or urban areas, such as townships, schools and residential areas.
A further 13% was “cultivated”, or used to grow crops, orchards or plantations. The majority of land by surface area is natural or semi-natural, that is, either completely untouched or minimally affected by human activity.
But the EFF is concerned about who owns land in South Africa. In 2019 the party told us that it had subtracted white-owned agricultural land (67%), state-owned land (14%) and land owned by Indian South Africans (5%) to conclude that only 14% of all South African land was “left for black African and coloured South Africans”. The latter two groups accounted for around 55 million people in 2022.
EFF claim based on outdated and misleading data
In 1993, the year before South Africa’s first democratic elections, a Stats SA agricultural census estimated that the country had about 82 million hectares of agricultural land. The government has referred to this land as “white-owned agricultural land”. This was 67% of South Africa’s total land area at the time.
But these figures are now decades old. Since 1994 black people have acquired some of this land through private sales and loans.
The figures for state-owned land are also out of date. The most recent estimate is from 2013 when the government identified 17.1 million hectares, or 14% of the total, as state-owned.
Another challenge is that some private land is owned by companies, trusts or other forms of ownership, making it difficult to determine the race of the owner. Prof Johann Kirsten, director of the Bureau for Economic Research at Stellenbosch University, told Africa Check that this would be impossible without a “massive project to locate company ownership and records of directors or owners to figure out the race classification”.
White landowners on average ‘own far above the national average’
If we look only at land that can be tied to a single private owner, allowing the race of the owner to be determined, this can be sorted into the following categories:
- Farms or agricultural holdings, the largest category by area.
- Erven, the category into which most urban land falls.
- Sectional title units, parts of a larger property that may be partly owned by several people, for example, a single unit in a housing complex.
So, who owns this land?
The 2017 land audit report, the most recent available, found that around 82% of all registered land (about 77% of all land) was privately owned in 2015. Of this private land, around 39% was owned by individuals (just over 30% of all land by area).
The race of these owners is broken down by category of land in the table below.
|
Table: Individual land ownership by race in South Africa |
|||||
|
Race |
Farms and agricultural holdings |
Erven |
Sectional title |
Total hectares |
Share of land |
|
White |
72% |
49% |
45% |
27 million |
22% |
|
Indian |
5% |
8% |
5% |
2.1 million |
2% |
|
Black |
4% |
30% |
17% |
1.5 million |
1% |
|
Coloured |
14% |
8% |
21% |
5.4 million |
4% |
Source: 2017 land audit report (Note: Percentages do not add up to 100% because the categories “co-ownership” and “other” are not included.)
As the report points out, this means that, on average white landowners “own far above the national average” area of agricultural land, while black landowners own far less. This pattern is less pronounced for other categories of land but is still present.
Even this limited picture is out of date. Kirsten said that while no official data had been released since the 2017 land audit report, his research bureau estimated that about 19.3 million hectares, or 25%, of white-owned farmland had been redistributed since 1994.
Based on the available data, the EFF overestimated the amount of agricultural land owned by white people and the amount of individual land owned by Indian people. We therefore rate the claim as incorrect.
In his foreword, Malema also claimed that the three wealthiest billionaires own more wealth than the poorest 26 million South Africans.
According to the Organisation for Economic Co-operation and Development, wealth is the value of all the assets an individual owns minus the value of all their liabilities at a given point in time.
Assets can include properties, investments and pension funds. Liabilities could be mortgages, loans and store credit. If we subtract the total value of these assets from the total value of liabilities, we arrive at a figure that represents wealth. This is known as your net worth.
Measuring wealth
It should be easy enough to calculate the difference between the value of what someone owes and what someone owns. But as we’ve written before, it’s difficult to determine exactly who owns what.
In South Africa, there is no obligation to declare wealth unless it generates income, such as interest from investments. We therefore have to rely on various estimates of wealth at the individual level, or aggregated data at the national level.
There are three common ways of measuring wealth, each with limitations:
- Survey data, such as the National Income Dynamics Study, which asks respondents what they would have left if they sold all their possessions and paid off all their debts. Such surveys struggle to collect data, particularly from wealthier groups of people, in the correct proportions.
- Personal income tax records, which use investment income as a proxy for wealth. Here data is limited to those above the threshold for paying income tax.
- National balance sheets as kept by the South African Reserve Bank. From these, we can gauge the total amount of wealth in private hands, but not how that wealth is distributed.
‘Extreme’ wealth inequality
With these challenges in mind, we asked Prof Imraan Valodia, director of the Southern Centre for Inequality Studies at the University of the Witwatersrand in Johannesburg, about the EFF’s claim. He referred us to two working papers published by the centre in 2020 and 2021.
The first paper combined all three of the methods described above and concluded that in 2017, the top 0.01% of the population (3,500 people) owned 15% of household wealth. This was more than the share of wealth owned by the bottom 90% of the population, made up of 32 million people.
According to the authors, this group of 3,500 individuals had an average wealth that was more than 1,500 times that of the average South African adult, and 6,000 times that of the bottom 90%.
The “extreme” differences were due to the exclusion of poorer groups from any form of wealth accumulation, and the concentration of all forms of assets at the top end of the population. Based on these findings, the authors in a second paper argued for a wealth tax.
Top three billionaires ‘certainly’ hold more wealth than poorest 50%
According to estimates by US business magazine Forbes, business person Johann Rupert and his family have the highest net worth in South Africa, with an estimated wealth of US$9.6 billion (about R181 billion).
In second place is Nicky Oppenheimer and his family, with an estimated wealth of $9.4 billion (about R177 billion), and in third place is Koos Bekker, with an estimated wealth of $2.6 billion (approximately R49 billion). Bekker is the founder and chair of Naspers, the internet, technology and multimedia multinational.
The combined net worth of these individuals and their families is an estimated R407.8 billion. But are these figures comparable, as in the EFF’s claim?
Neva Makgetla, a senior economist at the economic research organisation Trade and Industrial Policy Strategies, told Africa Check that there was no problem with the comparison.
“I don’t know the wealth of the top three billionaires, but it’s certainly more than the poorest 50% of citizens, which is essentially the claim,” she said.
Makgetla explained that people in the latter group usually don’t have employer pensions or savings. “Most actually own their residence, but it has essentially no market value because they need it to live in and most of the dwellings are traditional, informal or government housing, for which there is no real market."
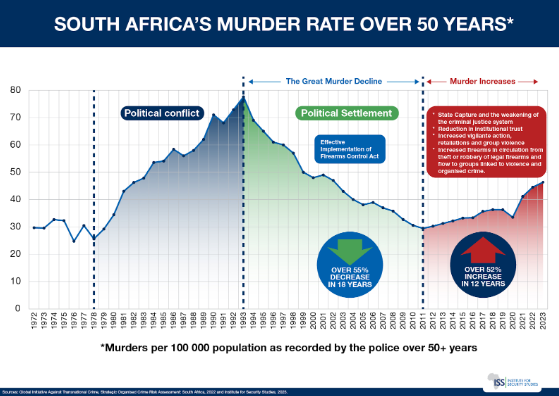
The issue of violent crime has been a hot topic for political parties contesting the elections. Africa Check confirmed in February 2024 that the murder rate, a proxy for violent crime, had risen by over 50% in the past decade.
While crime statistics are unreliable for various reasons, murders are considered to be a more accurate reflection of the actual number of crimes committed. They can be independently verified and are usually reported because “dead bodies are hard to hide, dispute or ignore”. This is according to researchers at the Institute for Security Studies (ISS), an independent research organisation in Pretoria.
The ISS compiles and verifies data from the South African police and others on its Crime Hub online portal. The data shows that the number of recorded murders has steadily risen since 2012/13, apart from a dip during the Covid pandemic “lockdowns” that restricted movement.
In 2012/13, the annual number of recorded murders was 16,213. In 2022/23, the figure was 27,494. This is an average of 20,369 per year over the last ten years.
Numbers, rates and averages
If interpreted as an average per year over the last ten years, this claim is correct. But the average changes over time.
For example, if we take the earliest year on the ISS Crime Hub as a starting point, 2005/06, the average is 19,240 per year up to the latest data. Using the last five years, the average is 22,999. That said, both of these are still close to the 20,000 average claimed by the EFF.
As we’ve written before, when assessing trends in murder prevalence, raw numbers don't take into account changes in population size over time.
Instead, experts use murder rates, which look at the number of murders per 100,000 people to see if there are changes over time. But in this case, the murder rate shows the same pattern: a steady increase over the last decade, after a decline in the years before.
On the issue of sanitation, the EFF manifesto claims that there are still households using “bucket toilets”.
When a bucket or pail is used to collect human waste, it is called a bucket toilet. These are used by households that do not have access to improved sanitation facilities, such as flushable toilets.
Improved sanitation has been a government priority for several years. A 2003 Strategic Framework for Water Services committed to eliminating bucket toilets by 2006. This deadline was pushed back to the end of 2007 in a 2006 state of the nation address by then president Thabo Mbeki.
In 2014, in another state of the nation address, former president Jacob Zuma announced that an “intensive programme” would be launched that year to completely replace bucket toilets with improved sanitation facilities.
By 2019, the elimination of bucket toilets was still a priority in the African National Congress’s election manifesto.
150,337 bucket toilets in 2022
Africa Check contacted Stats SA for data on the number of households using bucket toilets. Service delivery statistics manager Niël Roux sent us figures by type of toilet facility. In 2002, 278,643 households used bucket toilets. By 2022, the latest year for which data is available, the number had fallen to 150,337.
A 2012 sanitation audit by the Department of Human Settlements found that bucket toilets were most prevalent in the Eastern Cape, Free State, Northern Cape and North West provinces. The Free State had the highest number of households using bucket toilets, at 32,042.
In March 2023, the portfolio committee on water and sanitation, the parliamentary body that oversees the Department of Water and Sanitation, visited the Free State and Northern Cape provinces. The committee reported that there were several delays in the completion of this programme in the Free State, while there were no estimated completion dates for the Northern Cape.
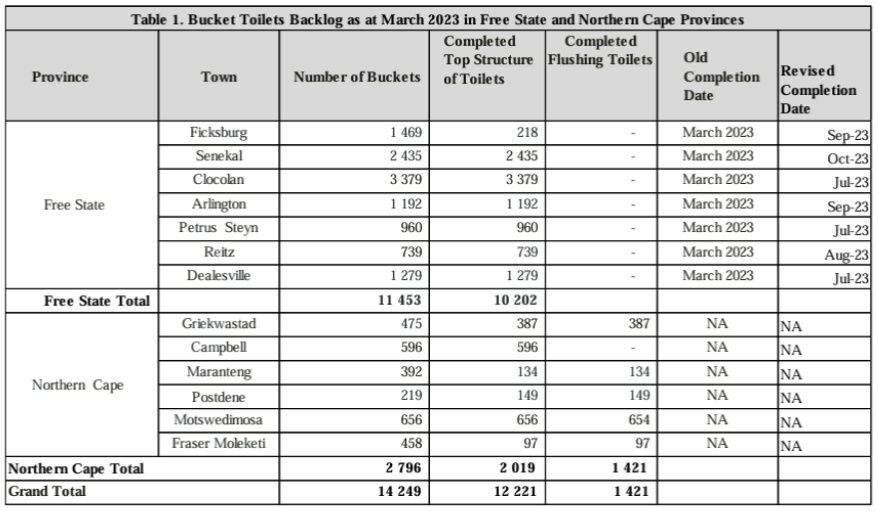
Source: Report by the Portfolio Committee on Water and Sanitation after an oversight visit to provinces
Although the number of households using bucket toilets has gradually decreased, the EFF was correct to claim that the undignified system persists today.
This report is produced as part of the work of a South African election coalition. In the run-up to the 2024 national elections, the coalition aims to ensure that the claims made by those in charge of state resources and delivering essential services are factually accurate. As voters head to the polls, it is increasingly important that they are able to make informed decisions.
You rely on us for factual information, we rely on you.
We depend on donations to bring you quality, fact-based information and keep public figures accountable.
Support trusted sources of information


Add new comment